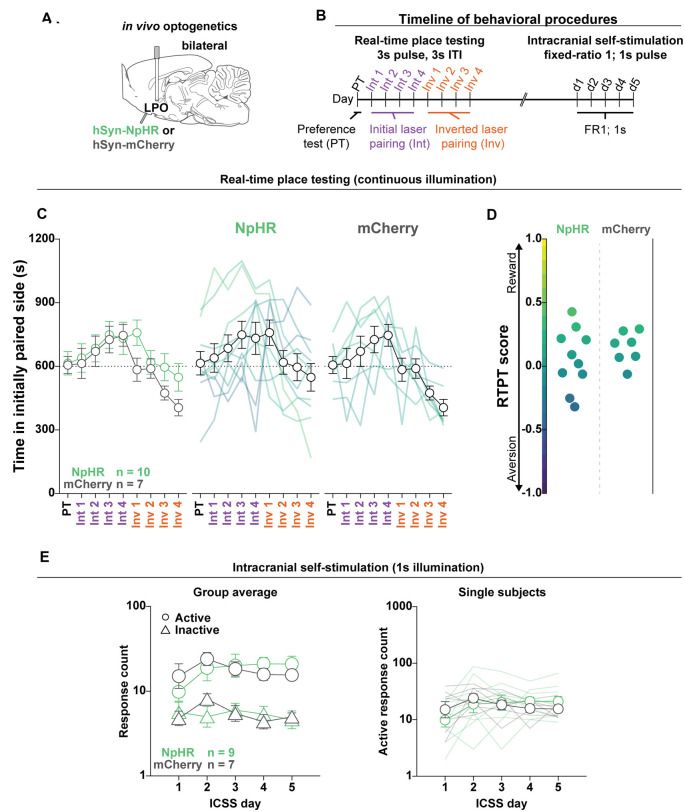
Figure 8.
Optogenetic inhibition of the LPO does not support ICSS or drive real-time place preference. (A) In vivo optogenetics setup: we injected either hSyn-HR (NpHR) or hSyn-mCherry (mCherry) bilaterally in the LPO and implanted optic fibers overlying the injection sites. (B) Timeline for RTPT and ICSS (procedure details can be found in legends for Figures 3, 4). (C) The mean time in the initially paired side across days of RTPT in NpHR (green) and mCherry (gray) groups; single rats are color-coded based on their RTPT score. The NpHR and the mCherry groups showed preference but did not show different behavior across days of RTPT (day effect: F(8,120) = 4.80, P < 0.001, group × day interaction: F(8,120) = 0.74, P = 0.65). (D) RTPT scores for rats in the NpHR and mCherry groups. (E) Self-administration behavior during ICSS at a fixed-ratio 1 for 1 s illumination. Left: the NpHR and the mCherry groups did not show different discrimination between the active hole (Active, circles) and inactive hole (Inactive, triangles; group × hole interaction: F(1,14) = 0.011, P = 0.92); right: the NpHR group did not make more or less active hole responses than the mCherry group throughout the ICSS procedure (group effect: F(1,14) < 0.001, P = 1.00). Active hole and inactive hole responses are shown on a log scale. In (C,E), faded lines depict values from individual rats; points and error bars depict mean and SEM, respectively.

