
Figure 1. Methods overview and virtual tissue microarrays for visualization of multiplex immunofluorescence results.
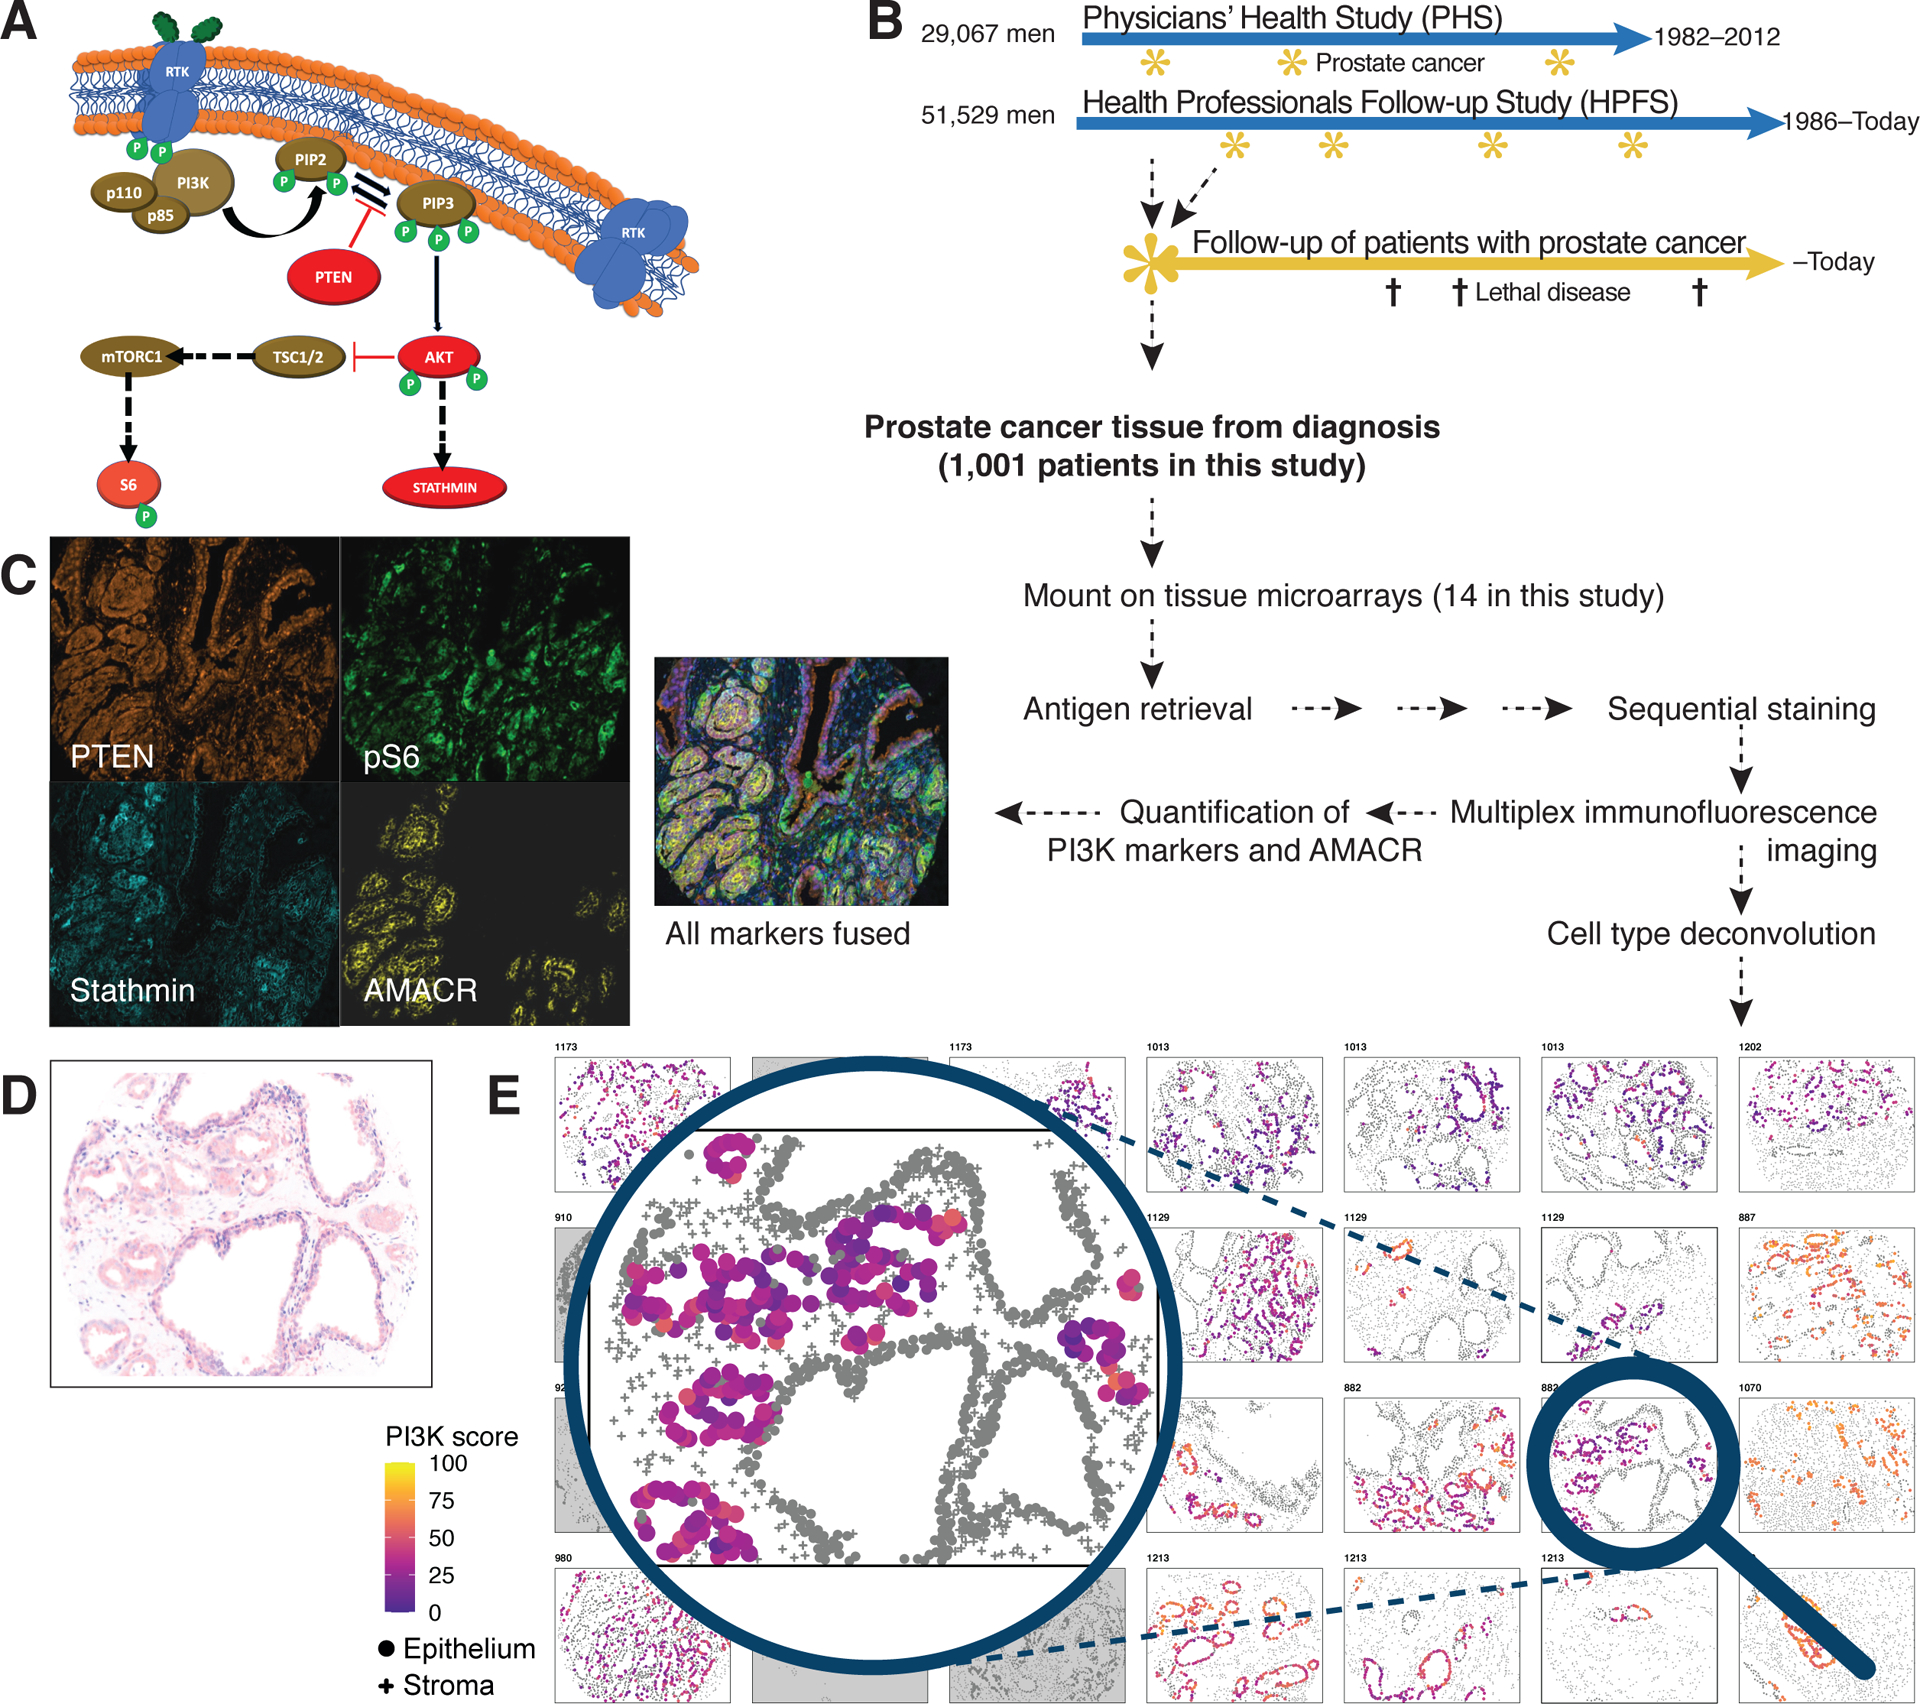
(A) An overview of the PI3K pathway, PTEN, stathmin, and phospho-S6 (pS6).
(B) Design of the prospective prostate cancer cohorts within the Health Professionals Follow-up Study (HPFS) and the Physicians’ Health Study (PHS).
(C)Example raw images from immunofluorescence imaging for PTEN, stathmin, and pS6 as markers of PI3K pathway activity and of AMACR for tumor masking, all from the same tumor core, as well as a fused image of all fluorescence channels.
(D)Hematoxylin–eosin appearance of the core highlighted from the virtual tissue microarray in (E).
(E)Virtual tissue microarray, an algorithm-based reconstruction of the multiplex immunofluorescence data. Cell type assignments from histology-based machine learning (round, epithelial cells; crosses, non-epithelial cells) and tumor cell recognition based on AMACR (colored, tumor cells; gray, non-tumor cells). Cell colors of tumor cells indicate PI3K activity scores.