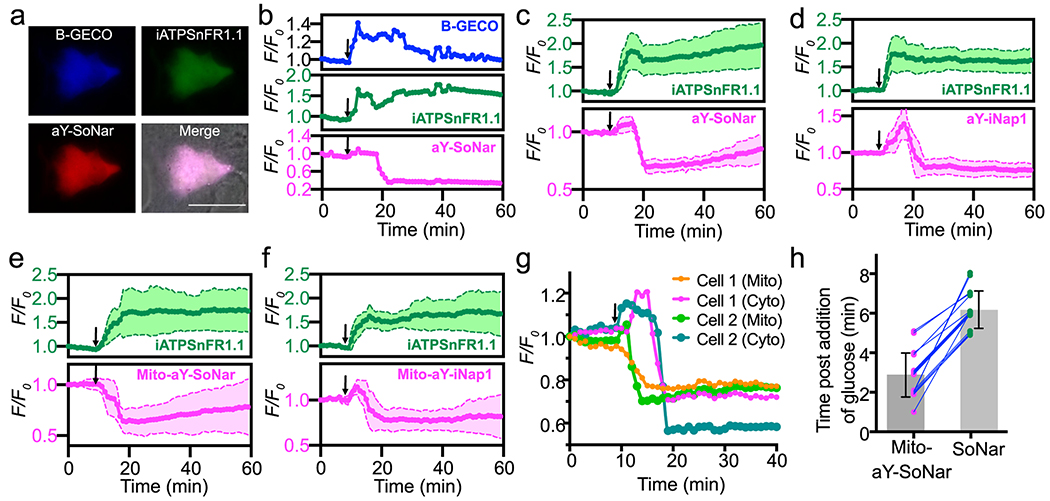
Figure 2. Fluorescence imaging of glucose-induced metabolic dynamics in pancreatic MIN6 β-cells.
(a) Representative tri-color images of MIN6 co-expressing B-GECO, iATPSnFR1.1, and aY-SoNar. n=3 repeats. Scale bar: 20 μm. Similar results were gained with three independent repeats. (b) Representative traces (F/F0) for B-GECO, iATPSnFR1.1, and aY-SoNar. Similar results were gained with three independent repeats. (c) Quantitative traces (F/F0) for co-expressed iATPSnFR1.1 and aY-SoNar (n=8 cells examined over 3 independent experiments). (d) Quantitative traces (F/F0) for co-expressed iATPSnFR1.1 and aY-iNap1 (n=7 cells examined over 3 independent experiments). (e) Quantitative traces (F/F0) for co-expressed iATPSnFR1.1 and mitochondrial aY-SoNar (n=8 cells examined over 3 independent experiments). (f) Quantitative traces (F/F0) for co-expressed iATPSnFR1.1 and mitochondrial aY-iNap1 (n=12 cells examined over 3 independent experiments). (g) Representative traces (F/F0) for two cells co-expressing cytosolic SoNar and mitochondrial aY-SoNar. Similar results were obtained with five independent repeats. (h) Comparison of response time (corresponding to the middle point of the fluorescence decrease phase) in individual MIN6 cells after glucose addition (n=17 cells examined over 5 independent experiments; Mito-aY-SoNar: 2.88±1.11 min; SoNar: 6.18±0.95 min; Wilcoxon matched-pairs signed rank test, P=0.00015). The time points for addition of 20 mM D-glucose are shown as arrows in panels b-g. Data are presented as mean and s.d. of indicated replicates.

