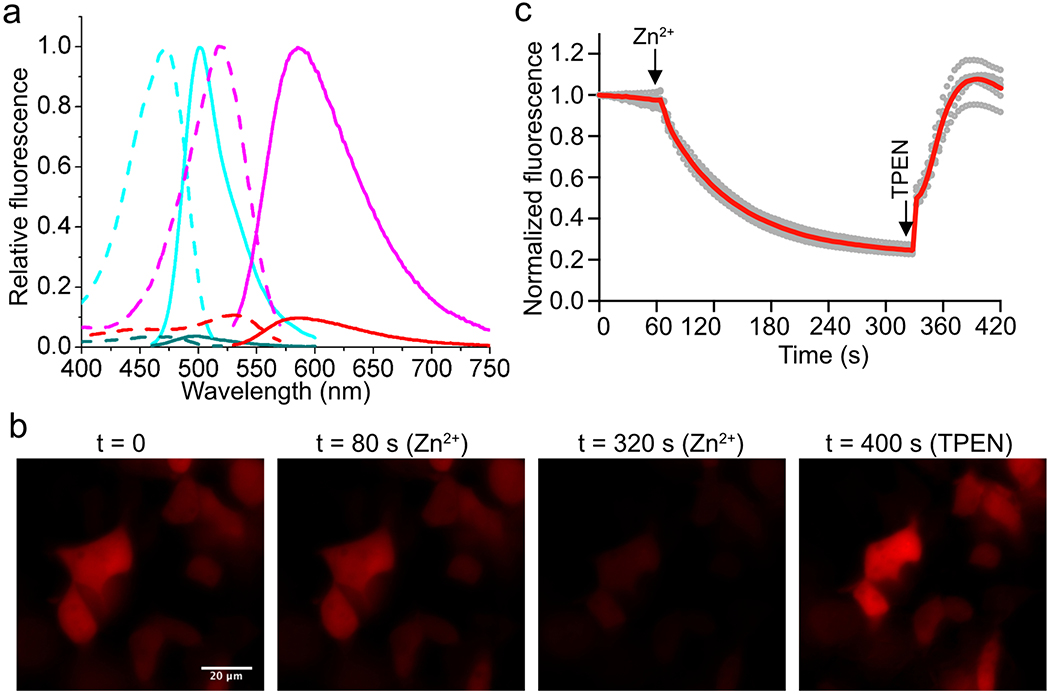
Extended Data Figure 3. Characterization of aY-modified ZnGreen1 (Zn2+ sensor).
(a) Fluorescence excitation (dash line) and emission (solid line) profiles for ZnGreen1 after addition of 1 mM EDTA (cyan) or 100 μM Zn2+ (dark cyan), and aY- ZnGreen1 after addition of 1 mM EDTA (magenta) or 100 μM Zn2+ (red). (b) Representative images of HEK 293T cells expressing aY-ZnGreen1 in response to sequential addition of 50 μM ZnCl2 with 5 μM pyrithione, and 200 μM TPEN. Scale bar: 20 μm. (c) Quantitative traces for randomly selected six single cells (gray dots) and their average (red line). Intensities are normalized to the values at t = 0 s. The time points for addition of chemicals are shown as arrows. These experiments were repeated three times with similar results using independent biological samples.

