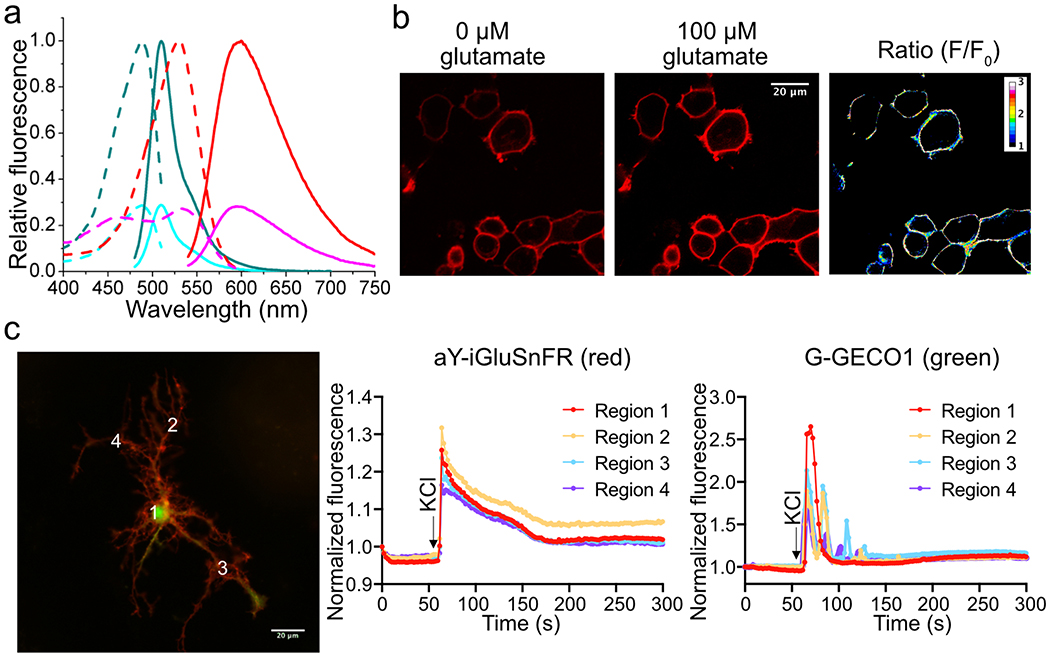
Extended Data Figure 4. Characterization of aY-modified iGluSnFR (glutamate sensor).
(a) Fluorescence excitation (dash line) and emission (solid line) profiles for iGluSnFR before (cyan) and after (dark cyan) addition of 100 μM L-glutamate, and aY-iGluSnFR before (magenta) and after (red) addition of 100 μM L-glutamate. (b) Representative images of HEK 293T cells expressing cell-surface-localized aY-iGluSnFR in response to addition of 100 μM L-glutamate. (c) Cultured mouse hippocampal neurons in response to 90 mM KCl (excitatory Tyrode’s saline buffer). Neurons were co-transfected to express cell-surface-localized aY-iGluSnFR (red fluorescence) and a Ca2+ indicator, G-GECO1 (green fluorescence). Quantitative traces for four different regions are presented. Intensities are normalized to the values at t = 0 s. These experiments were repeated three times with similar results using independent biological samples. Scale bar: 20 μm.

