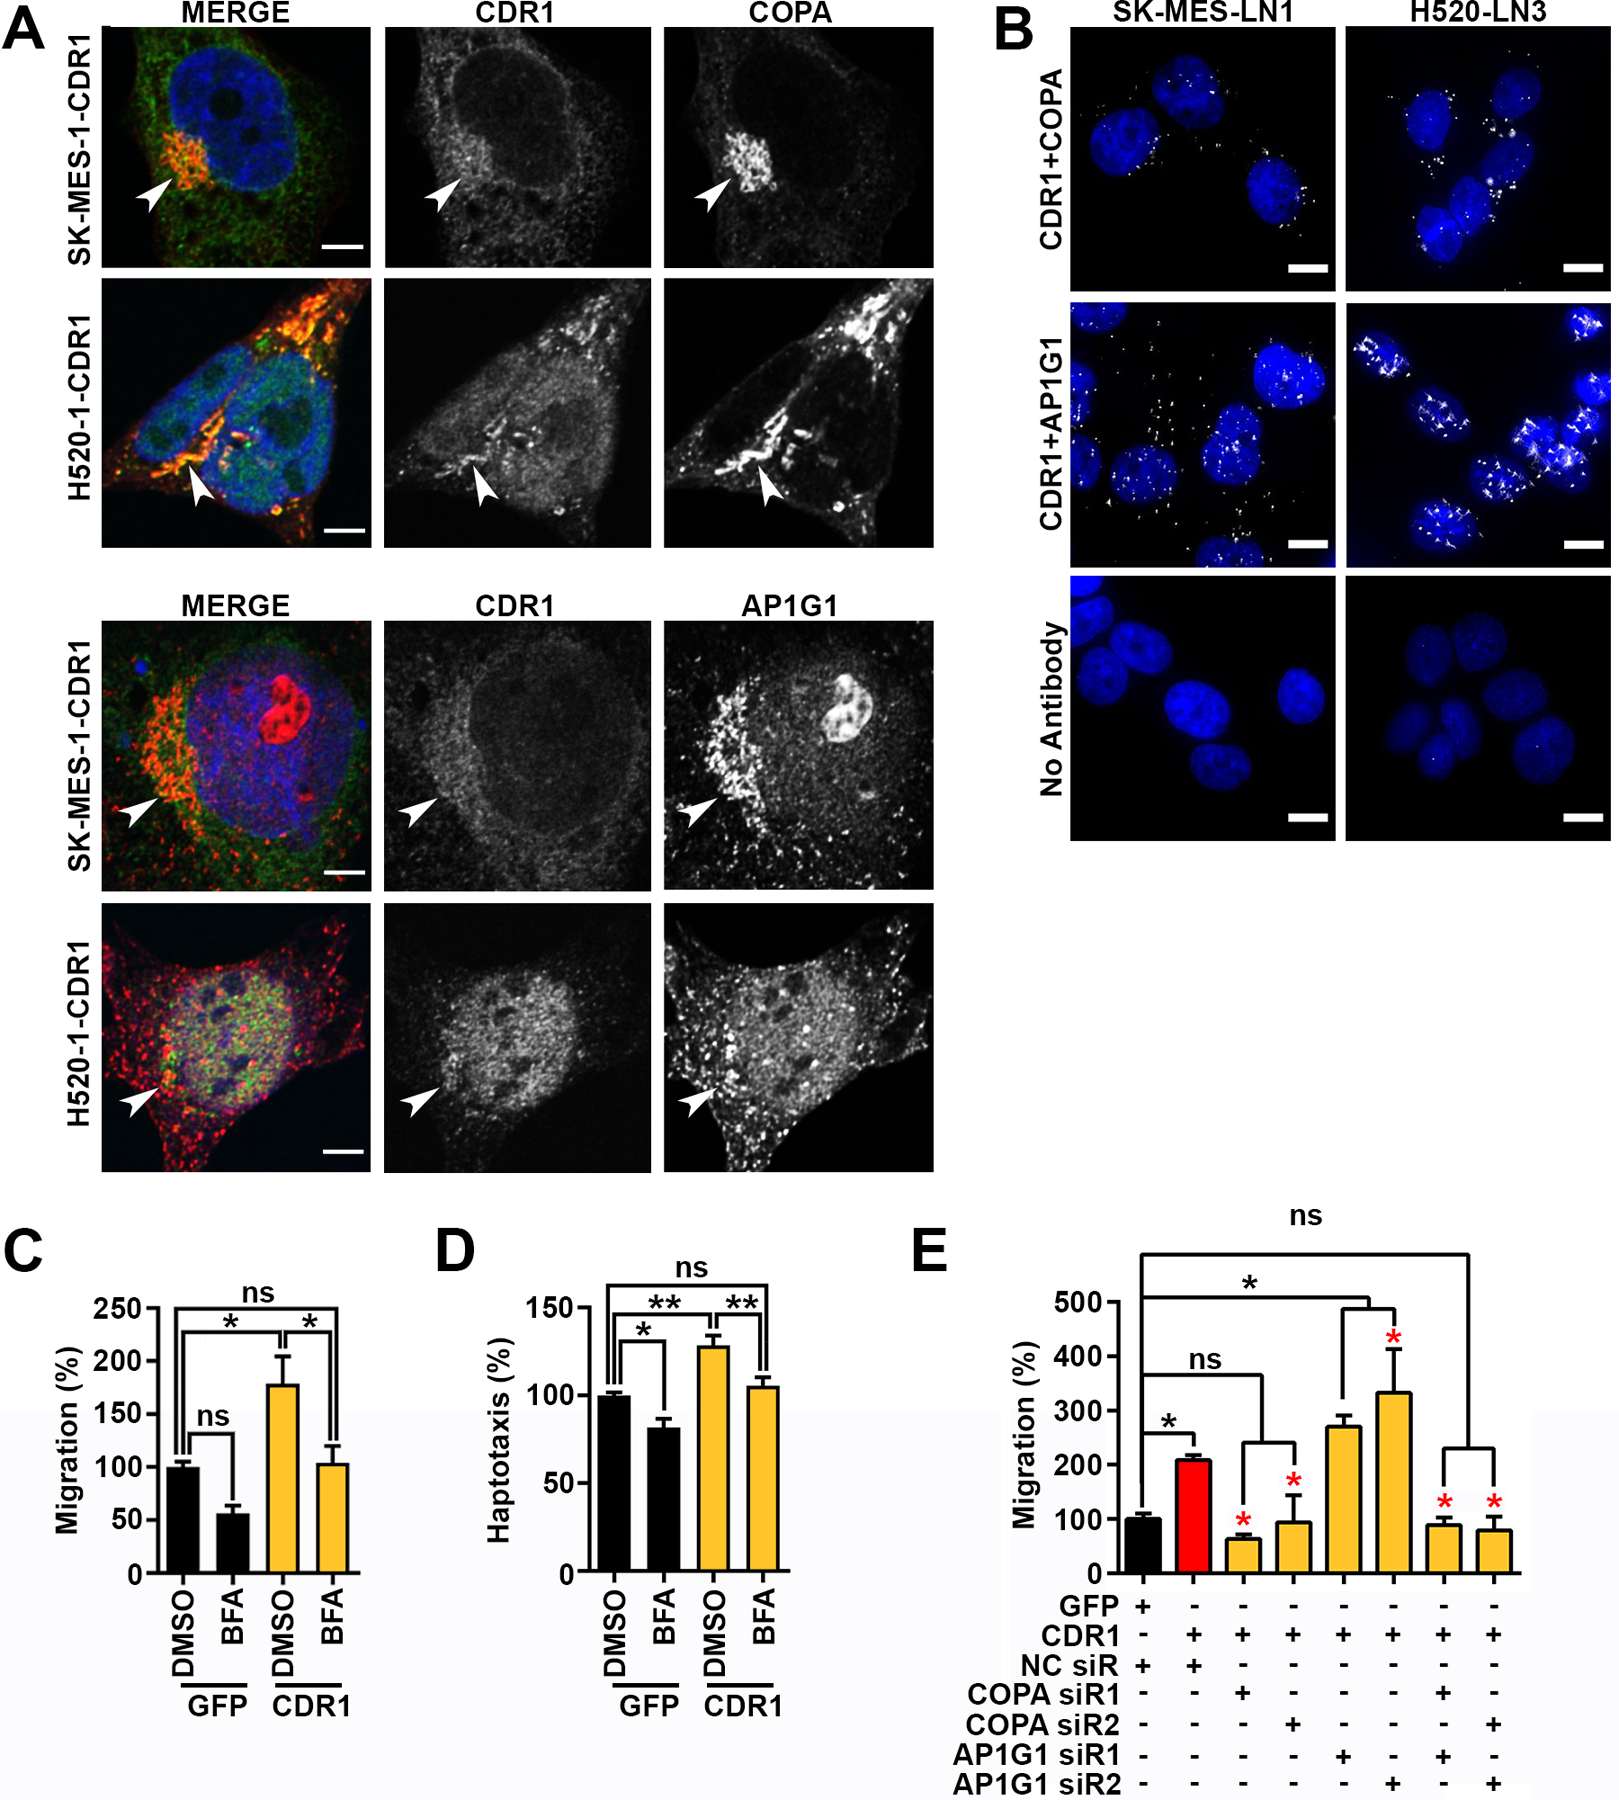
Figure 6. CDR1 driven migration is dependent on vesicular trafficking.

A, Localization of COPA or AP1G1 (red) and CDR1 (Green) in SK-MES-1 CDR1 or H520-CDR1. Shown is a single slice of a z-stack, arrows indicate perinuclear Golgi structures, scale bar is 5 μm. B, Proximity ligation assays showing close proximity of CDR1 with COPA or AP1G1 at endogenous levels in SK-MES-LN1 and H520-LN3 cells, scale bar is 10 μm. C and D, quantification of C, trans-well migration or D, haptotaxis of SK-MES-1 GFP or CDR1 with vehicle DMSO or 1 μg/mL Brefeldin A (BFA), shown are the mean and SEM of three experiments performed in duplicate. E, quantification of trans-well migration of SK-MES-1 CDR1 48 hours post transfection with negative control (NC), COPA, or AP1G1 siRs, shown are the mean and SEM of three experiments performed in duplicate. Black asterisks indicate significance from GFP NC siR, red asterisks indicate significance from CDR1 NC siR. * p<0.05, ** p<0.01 by ANOVA corrected for multiple testing using the FDR.
