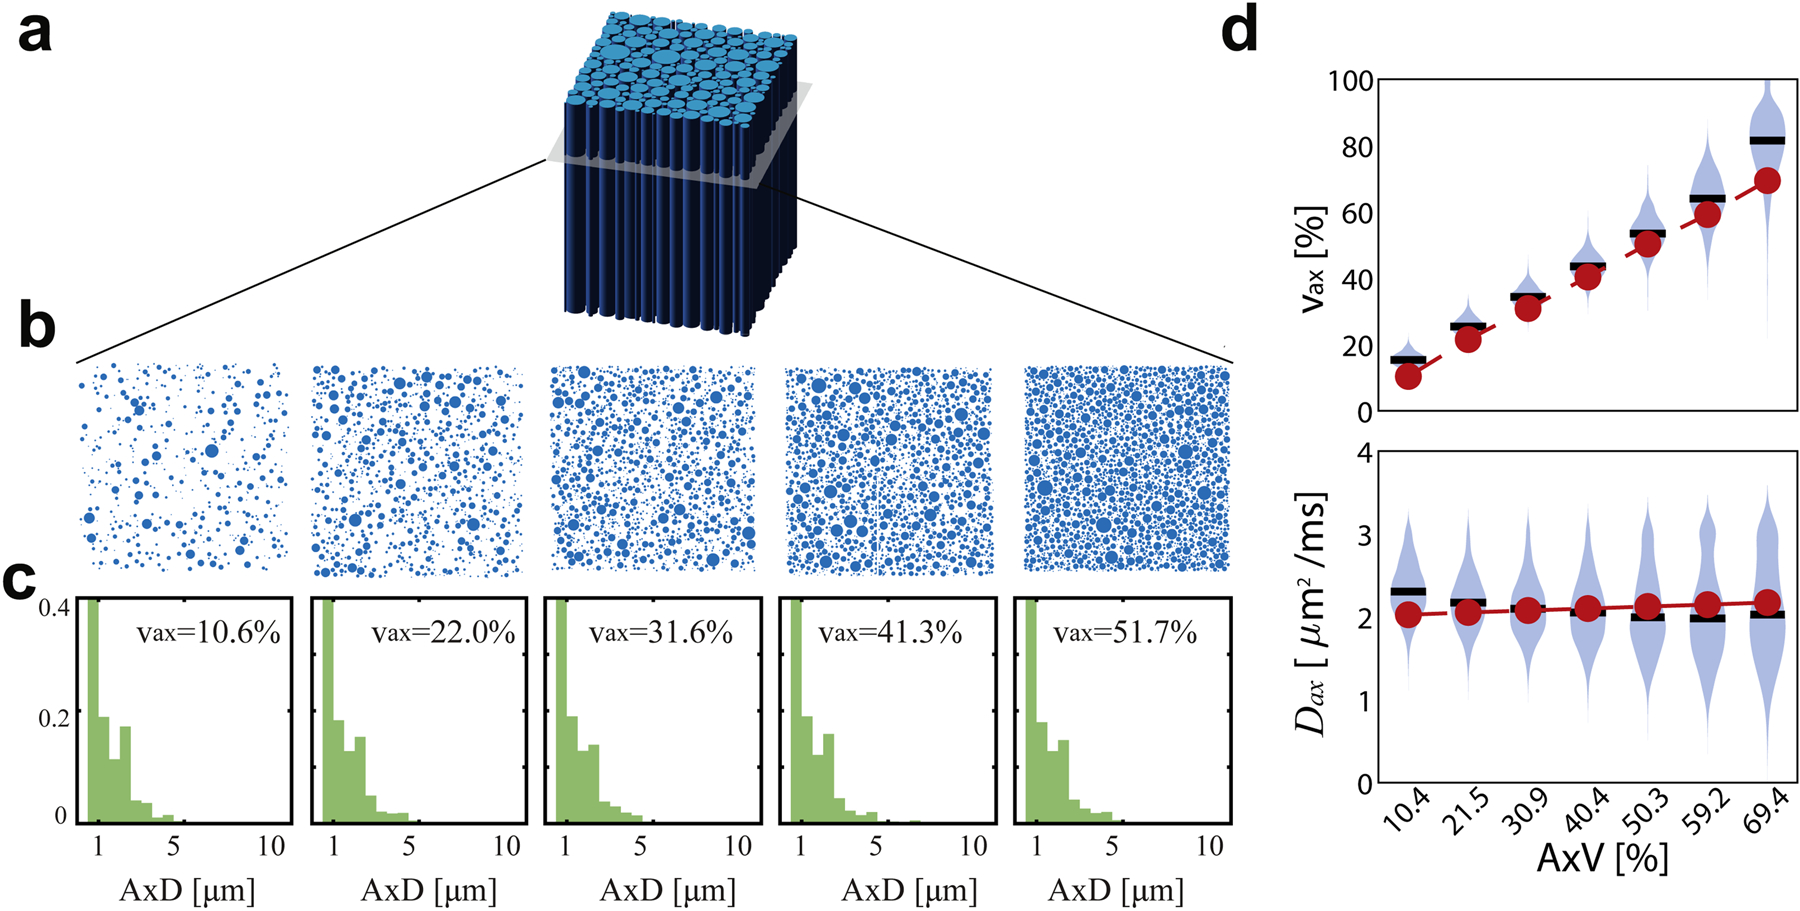
Figure 3.

(a) Tissue was simulated as randomly packed parallel cylinders with varying axon volume fraction (AxV) (b,c). Violin plots in (d) and (e) show estimations of νax and Dax with the mean values in black, distribution in blue, and ground truth in red.
