Figure 4.

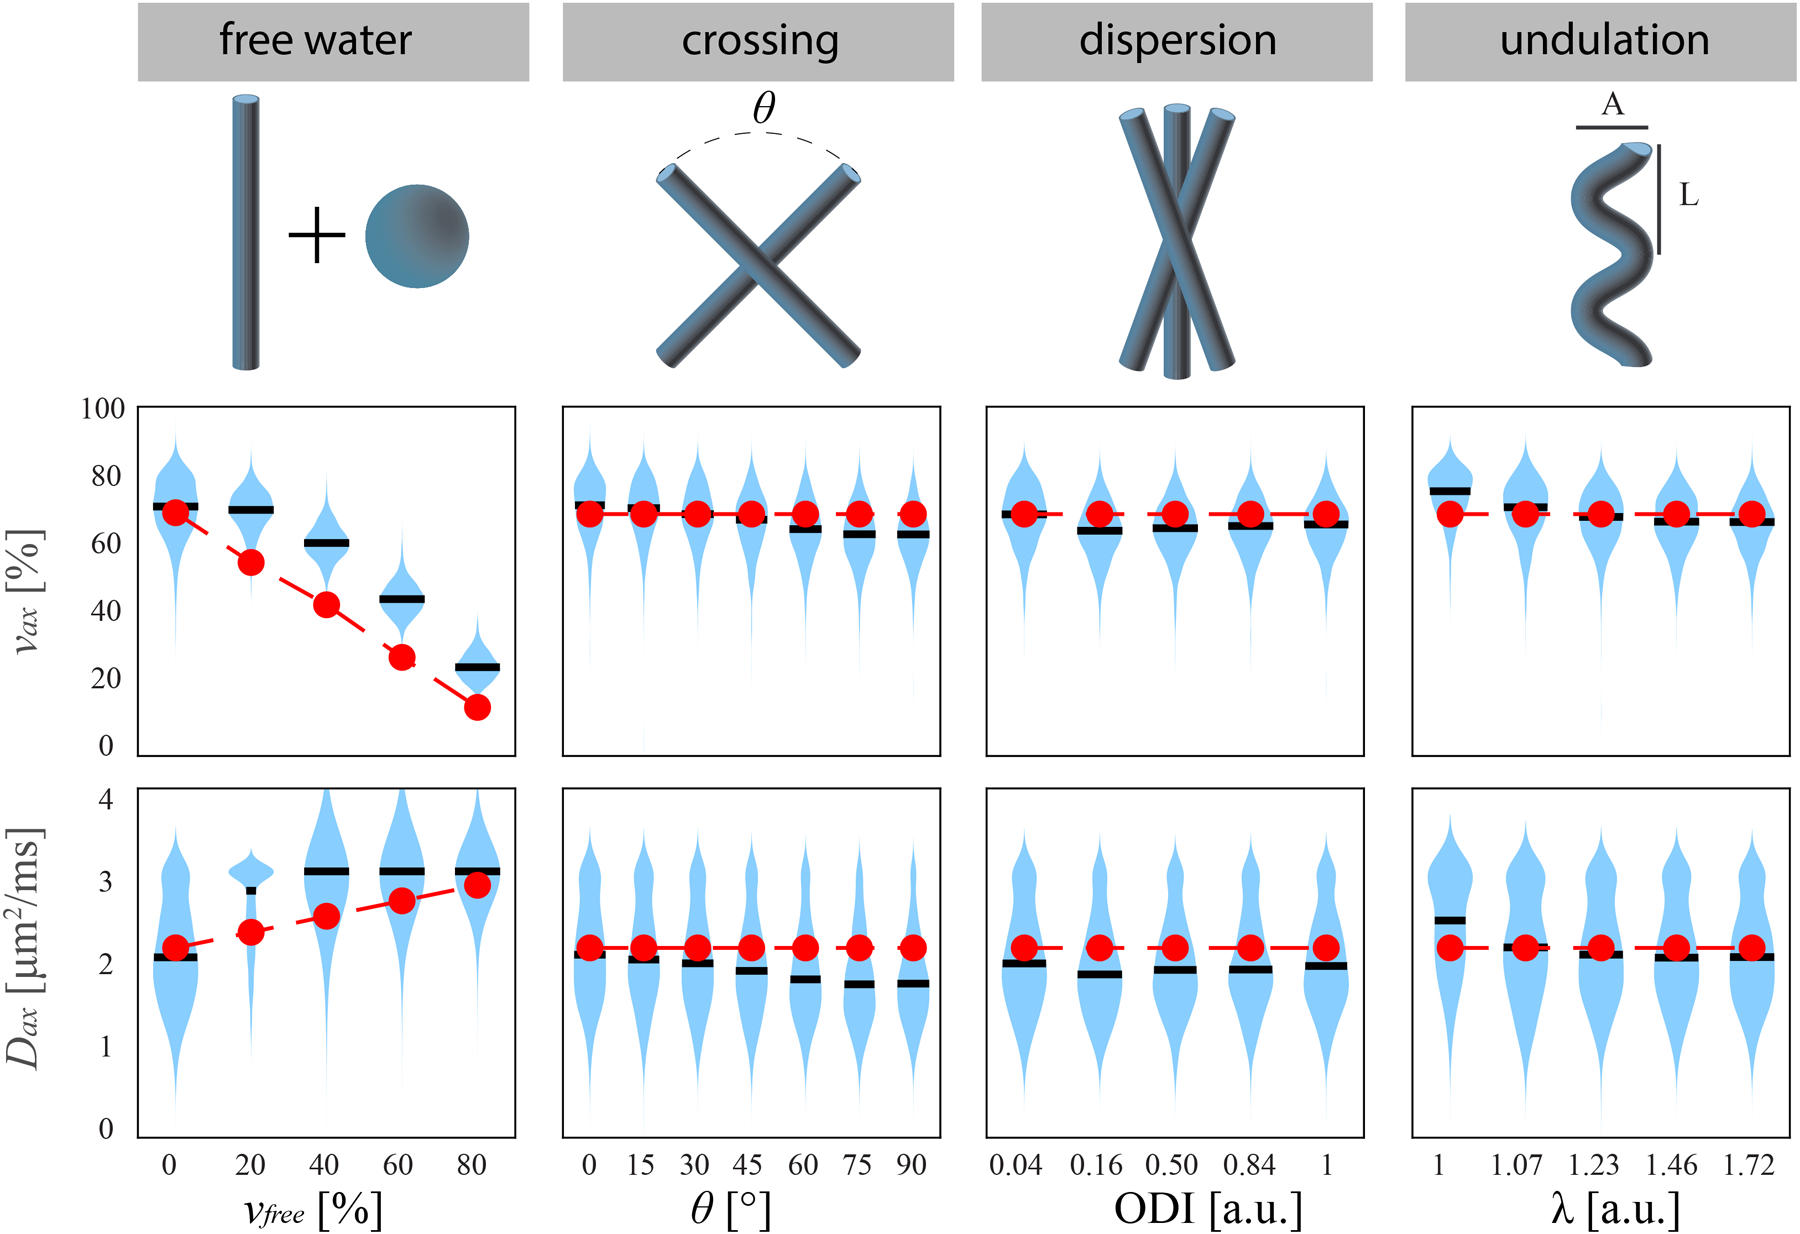
(top) Schematic of four neural geometries tested in simulation. (middle) νax and (bottom) Dax estimates from N=1000 trials each, with the mean values in black, distribution in blue, and ground truth in red.

(top) Schematic of four neural geometries tested in simulation. (middle) νax and (bottom) Dax estimates from N=1000 trials each, with the mean values in black, distribution in blue, and ground truth in red.