Figure 5.

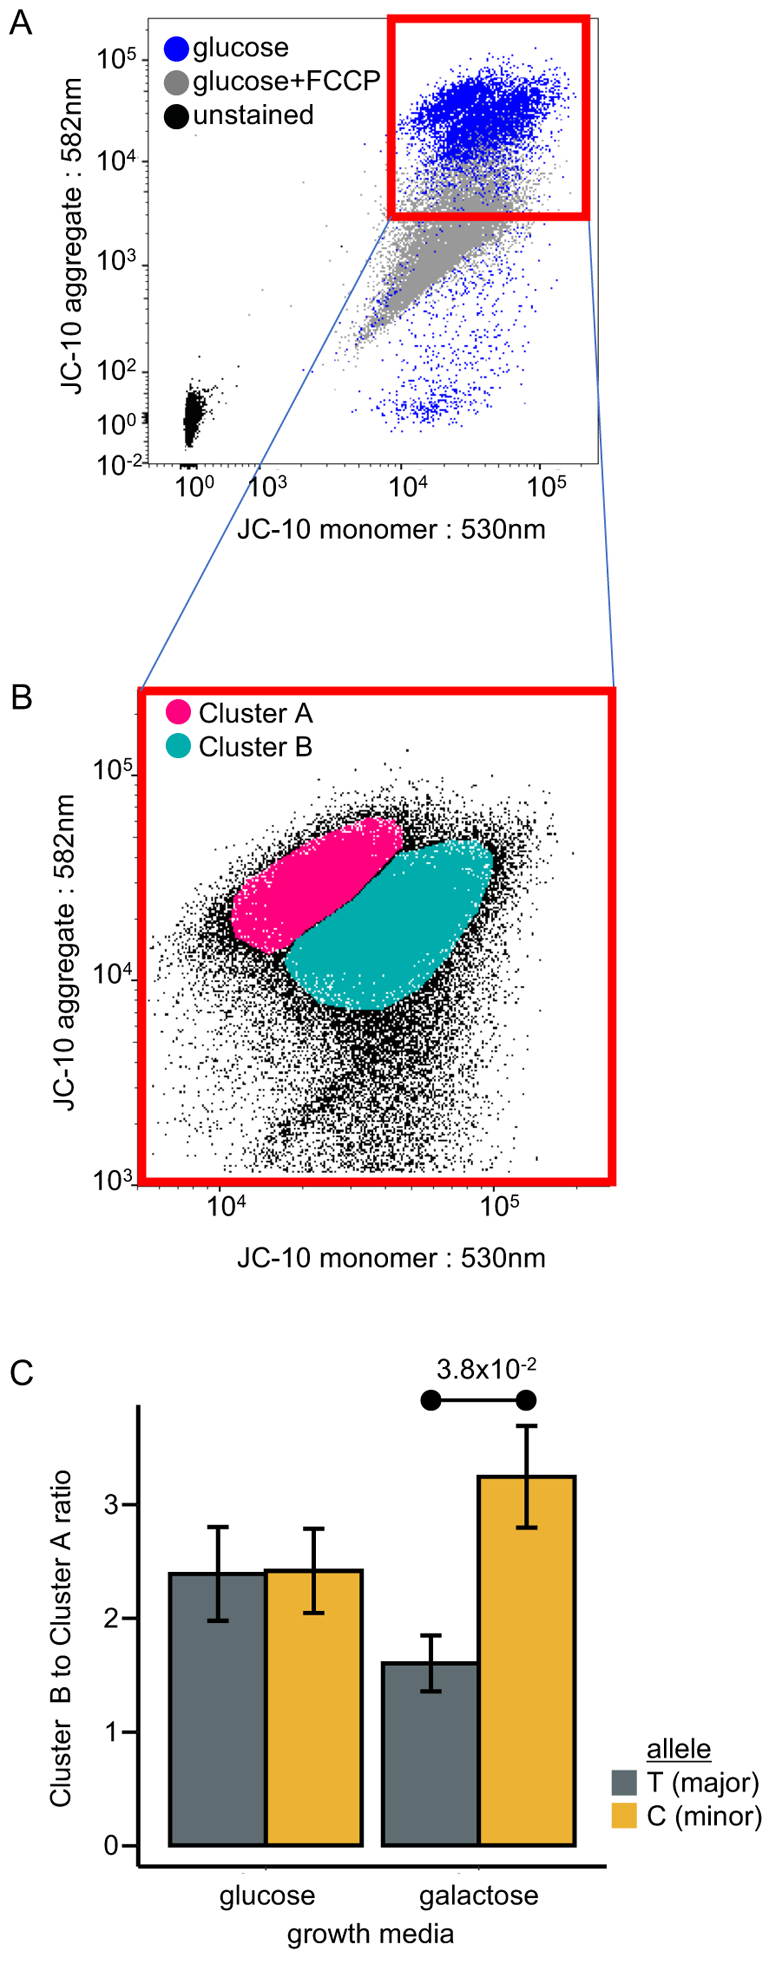
Cellular mitochondrial assay for functional characterization of SNP m.2352T>C using JC-10 staining. (A) Fluorescence scatter plot showing JC-10 aggregate intensity (582nm channel) as a function of JC-10 monomer intensity (530nm channel). Plotted data from JC-10 stained B lymphoblast cells either without treatment (blue) or treated with mitochondrial uncoupling agent, FCCP (10 μM) (grey). Background signal shown by cells left unstained for JC-10 (black). (B) Representation of the two cell clusters of live B lymphoblasts, A and B, generated by density-based spatial clustering of applications with noise (DBSCAN) on a fluorescence scatter plot showing JC-10 aggregate intensity (582nm channel) as a function of JC-10 monomer intensity (530nm channel). (C) The ratio of cells in cluster B, which have lower ΔΨm, to cluster A, which have higher ΔΨm. Ratio measurements performed in glucose and galactose-containing growth media. In each medium, ratio measurements were performed for B lymphoblasts with the T- (major) and C- (minor) alleles. Error bars represent mean ± SEM. 10 biological replicates for each treatment group.
