Figure 6.

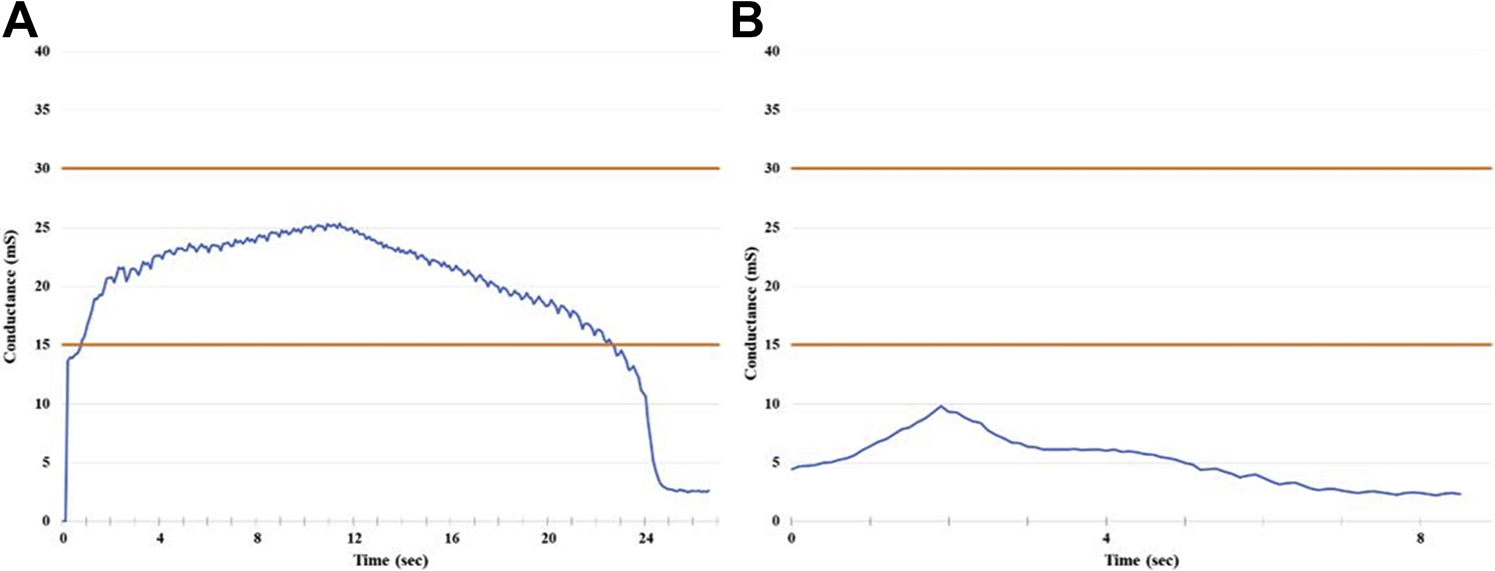
Representative conductance graphs from ablations reaching (A) and not reaching (B) the Constant Power (CP) zone. CP zone (15–30mS) is depicted between the orange lines.

Representative conductance graphs from ablations reaching (A) and not reaching (B) the Constant Power (CP) zone. CP zone (15–30mS) is depicted between the orange lines.