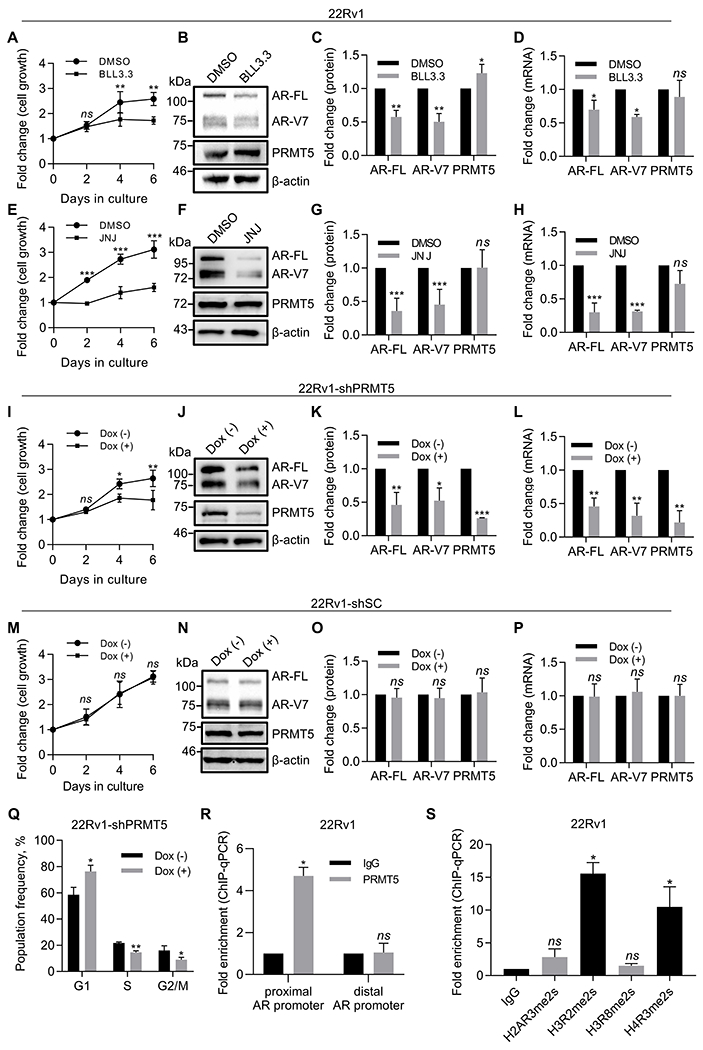
Figure 1. PRMT5 promotes growth of CRPC cells via epigenetic activation of AR expression.

A, Growth curve (MTT assay) of 22Rv1 cells incubated with 10 µM PRMT5 inhibitor (BLL3.3) or equal volume of vehicle (DMSO) for 6 days. B-С, Representative western blot images (B) and quantification (С) of protein expression in cell lysates from Day 6 of A. D, qPCR analysis of gene expression in cells from Day 6 of A. E, Growth curve (MTT assay) of 22Rv1 cells incubated with 10 µM PRMT5 inhibitor (JNJ-64619178, referred to as JNJ) or equal volume of vehicle (DMSO) for 6 days. F-G, Representative western blot images (F) and quantification (G) of protein expression in cell lysates from Day 6 of E. H, qPCR analysis of gene expression in cells from Day 6 of E. I, Growth curve (MTT assay) of 22Rv1 cells with doxycycline-inducible PRMT5 knockdown (22Rv1-shPRMT5) incubated in the presence (Dox (+)) or absence (Dox (–)) of doxycycline for 6 days. J-K, Representative western blot images (J) and quantification (K) of protein expression in cell lysates from Day 6 of I. L, qPCR analysis of gene expression in cells from Day 6 of I. M, Growth curve (MTT assay) of 22Rv1 cells with doxycycline-inducible scramble control expression (22Rv1-shSC) incubated in the presence (Dox (+)) or absence (Dox (–)) of doxycycline for 6 days. N-O, Representative western blot images (N) and quantification (O) of protein expression in cell lysates from Day 6 of M. P, qPCR analysis of gene expression in cells from Day 6 of M. Q, Flow cytometry analysis of cells following PI staining at Day 6 of I (sub-G1 cells were gated out). R, ChIP-qPCR for PRMT5 binding to the proximal or distal AR promoter. S, ChIP-qPCR for the enrichment of the indicated histone methylations on the proximal promote region of AR. For MTT, western blotting, cell cycle, and qPCR analysis, statistical significance of group difference was determined for ‘DMSO vs BLL3.3’, ‘DMSO vs JNJ’, or ‘Dox (–) vs Dox (+)’. For ChIP-qPCR, values were normalized to the corresponding IgG control, and indicated statistical significance of group difference was determined for ‘specific IP vs IgG IP’. For all experiments, results are mean ± SD from 3 independent experiments. For western blotting of AR, the AR N-20 antibody (sc-816, Santa Cruz) was used. Student’s t-test with Welch’s correction was performed to determine statistical significance of group difference. ns P > 0.05, * P < 0.05, ** P < 0.01, *** P < 0.001.
