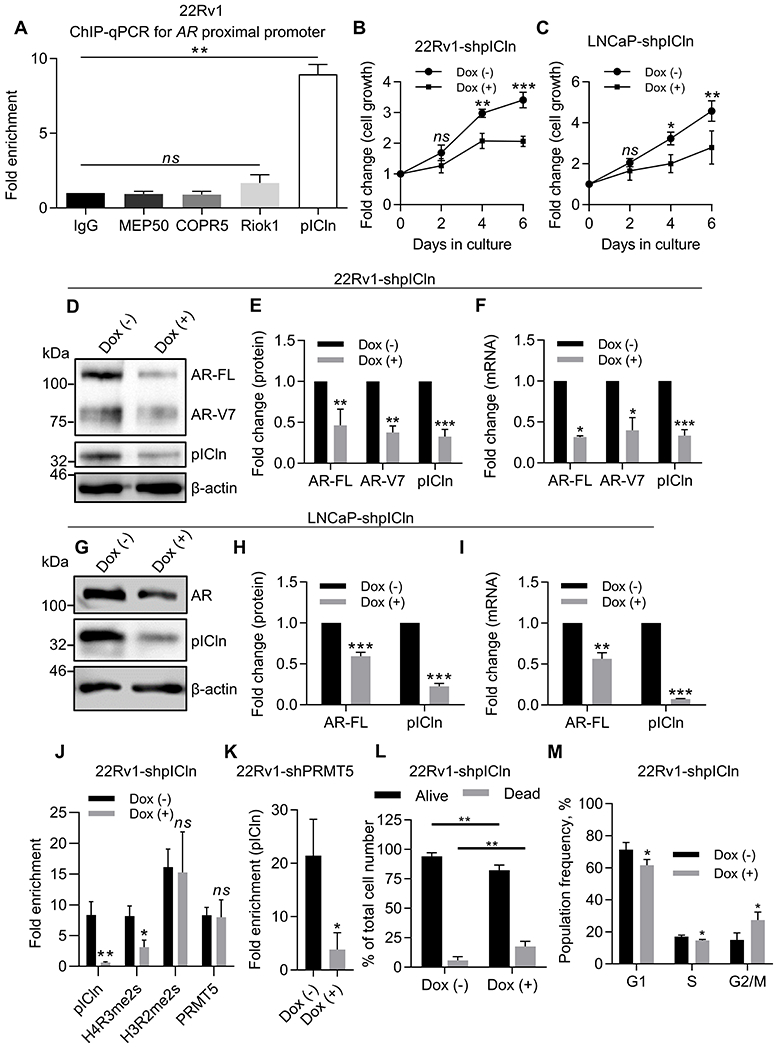
Figure 3. pICln participates in epigenetic activation of AR transcription.

A, ChIP-qPCR assay for binding of PRMT5-interacting proteins to the proximal AR promoter in 22Rv1 cells. Values were normalized to IgG control. B-C, Growth curve (MTT assay) of 22Rv1 (B) or LNCaP (C) cells with Dox-inducible pICln knockdown (shpICln). D-E, Representative western blot images (D) and quantification (E) of protein expression in 22Rv1 after 6 days of pICln knockdown. F, qPCR analysis of gene expression in 22Rv1 after 6 days of pICln knockdown. G-H, Representative western blot images (G) and quantification (H) of protein expression in LNCaP after 5 days of pICln knockdown. I, qPCR analysis of gene expression in LNCaP after 5 days of pICln knockdown. J, ChIP-qPCR assay for pICln and H4R3me2s presence at the proximal AR promoter in 22Rv1 upon pICln knockdown. K, ChIP-qPCR assay for pICln presence at the proximal AR promoter upon PRMT5 knockdown. L, Trypan blue cell viability analysis in 22Rv1-shpICln cells after 6 days of pICln knockdown. M, Flow cytometry analysis of fixed and stained with propidium iodide 22Rv1-shpICln cells after 6 days of pICln knockdown. For MTT, western blotting, cell cycle, and qPCR analysis statistical significance of group difference was determined for ‘Dox (–) vs Dox (+)’. For ChIP-qPCR, values were normalized to the corresponding IgG control, and indicated statistical significance of group difference was determined for ‘specific IP vs IgG IP’ (A) or ‘Dox (–) vs Dox (+)’ (J, K). For all experiments, results are mean ± SD from 3 independent experiments. For western blotting of AR, the AR N-20 antibody (sc-816, Santa Cruz) was used. Student’s t-test with Welch’s correction was performed to determine statistical significance. ns P > 0.05, * P < 0.05, ** P < 0.01, *** P < 0.001.
