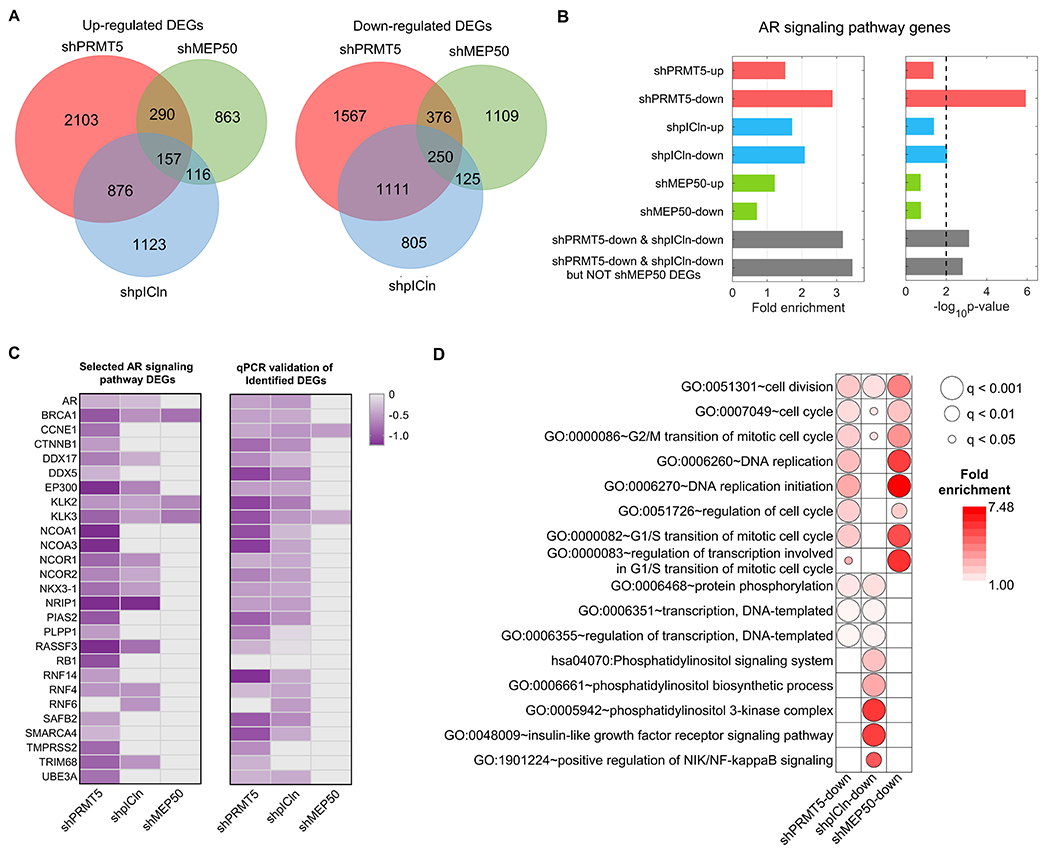
Figure 4. PRMT5 and pICln regulate the AR signaling independently of MEP50.

A, RNA-seq analysis of 22Rv1 cells upon 6 days of shRNA-mediated knockdown of PRMT5 (shPRMT5), MEP50 (shMEP50), or pICln (shpICln). Venn diagrams indicate overlap of upregulated and downregulated DEGs among three experiments. B, Presence of AR signaling pathway (GO:0030521) among identified up- and downregulated DEGs. C, Heatmap indicating expression fold change (FC, log2) of individual AR signaling pathway genes down-regulated upon knockdown of PRMT5 (shPRMT5), MEP50 (shMEP50), and pICln (shpICln) from RNA-seq analysis (left panel) and qPCR validations (right panel). D, Gene ontology (GO) analysis of DEGs that were downregulated upon knockdown of PRMT5 (shPRMT5-down), pICln (shpICln-down), and MEP50 (shMEP50-down). Presented are selected GO terms significantly enriched in the DEG sets related to cell-cycle regulation, DNA replication, transcription, and phosphorylation. The color of each dot indicates the fold enrichment for the GO term, whereas the size of the dot indicates q-value (FDR-corrected p-value) of statistical significance of the enrichment.
