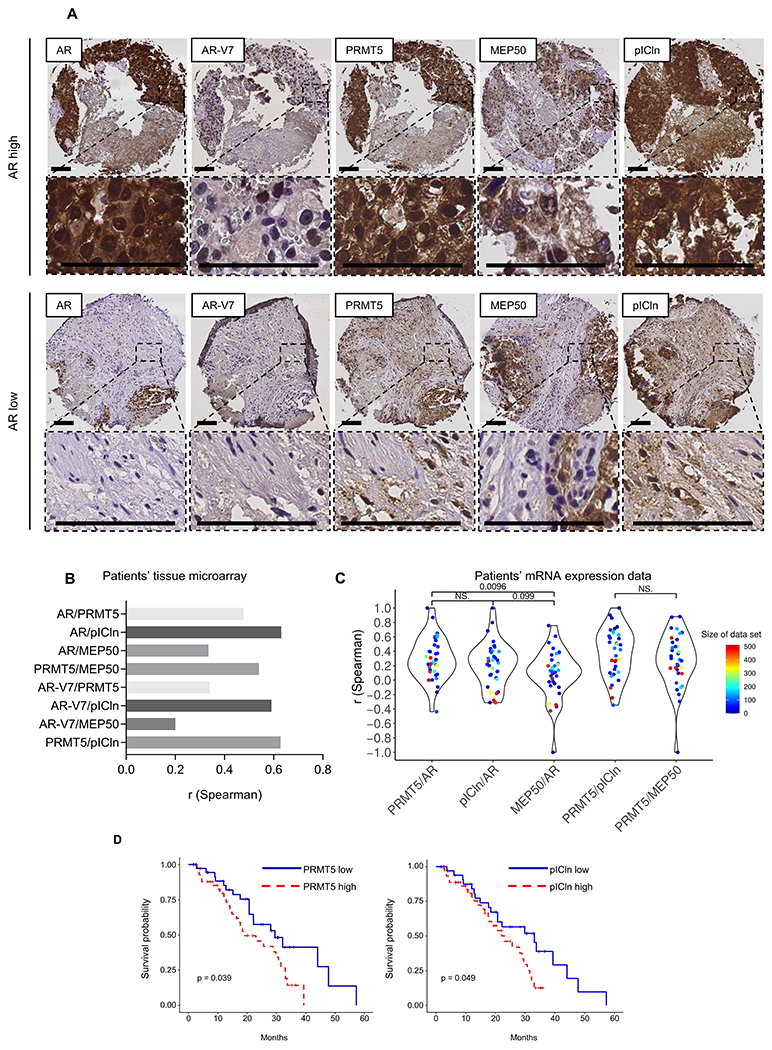
Figure 5. PRMT5 and pICln expression positively correlates with AR in CPRC patients.

A-B, AR, AR-V7, PRMT5, pICln, and MEP50 protein expressions were analyzed by IHC in metastatic CRPC samples. A, Representative IHC images of AR, AR-V7, PRMT5, pICln, and MEP50 expression. Scale bar indicates 100 μm. B, Spearman correlations of protein-level expression of AR, AR-V7, PRMT5, pICln, and MEP50 in CRPC tissues. C, Spearman correlations of mRNA expression levels between AR, PRMT5, pICln, and MEP50. The mRNA expression data for 4624 patient samples were obtained from 34 published datasets. Each dot denotes one dataset, representing the gene expression correlation between the pair of selected mRNAs. The dot color indicates the sample size of corresponding dataset. D, Kaplan-Meier curves comparing influences of mRNA expression levels of PRMT5 and pICln, respectively, on patients’ survival. Red curves represent patients with high (top 50%) expression of PRMT5 and pICln, whereas blue ones are groups with low (bottom 50%) expression. The mRNA expression and patient survival data were downloaded from the cBioportal SU2C-PCF dataset.
