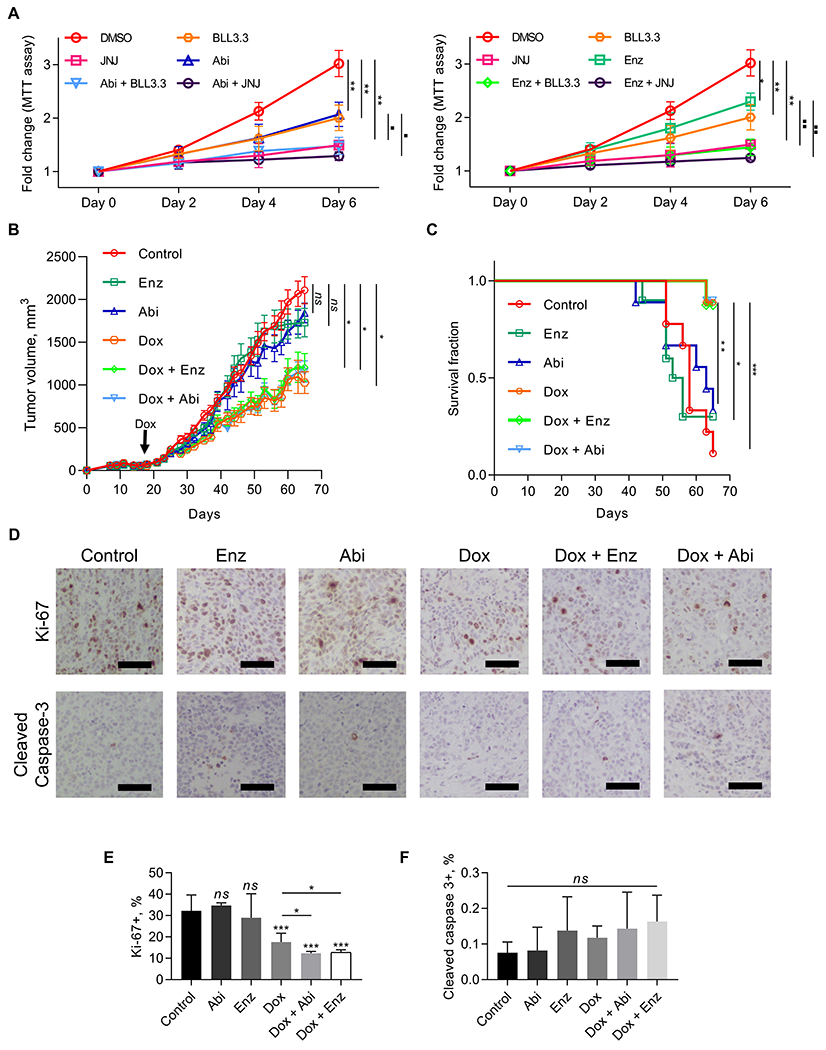
Figure 7. Targeting PRMT5 overcomes resistance to ASI treatment in CRPC cells and tumors.

A, Growth curve (MTT assay) of 22Rv1 cells incubated with 10 µM PRMT5 inhibitor (BLL3.3 or JNJ-64619178, referred to as JNJ) or 10 µM of either abiraterone acetate (Abi) or enzalutamide (Enz), or equal volume of vehicle (DMSO) for 6 days. Cell proliferation assays were performed at the indicated time points, and OD550 values were normalized to values from Day 0 for each cell line. ANOVA test with Welch’s correction was performed to determine statistical significance. Stars represent significant difference with DMSO group, squares represent significant difference of “Abi” vs “Abi + BLL3.3”, “Abi vs Abi + JNJ”, “Enz” vs “Enz + BLL3.3”, or “Enz vs Enz + JNJ” groups. Results are mean ± SD from 3 independent experiments. B, 22Rv1 cells with Dox-inducible knockdown of PRMT5 were injected subcutaneously into right flanks of surgically castrated male NRG mice. Once tumors reached ~100 mm3, tumor-bearing mice were treated with doxycycline in drinking water, or abiraterone acetate per oral 200 mg/kg/day, or enzalutamide 25 mg/kg/day, or combination. Tumor growth curves were determined and compared between groups (ANOVA; *, P < 0.05). C, Survival of tumor–bearing mice is represented as Kaplan–Meier plot. D-F, At the end of treatment, tumors were resected and probed for cleaved caspase-3 and Ki-67 using IHC. Shown are representative images of IHC staining (D) and the quantified percentage of positively stained cells out of the total number of cells counted (E, F). Results are mean ± SD (n = 10 per group). Student’s t-test was performed to determine statistical significance of difference vs “Control” group. ns P > 0.05, *** P < 0.001, **** P < 0.0001.
