
Figure 1. RNA-seq analysis in liver in response to chronic plus binge ethanol: differentially expressed genes (DEGs) and KEGG pathway analysis.
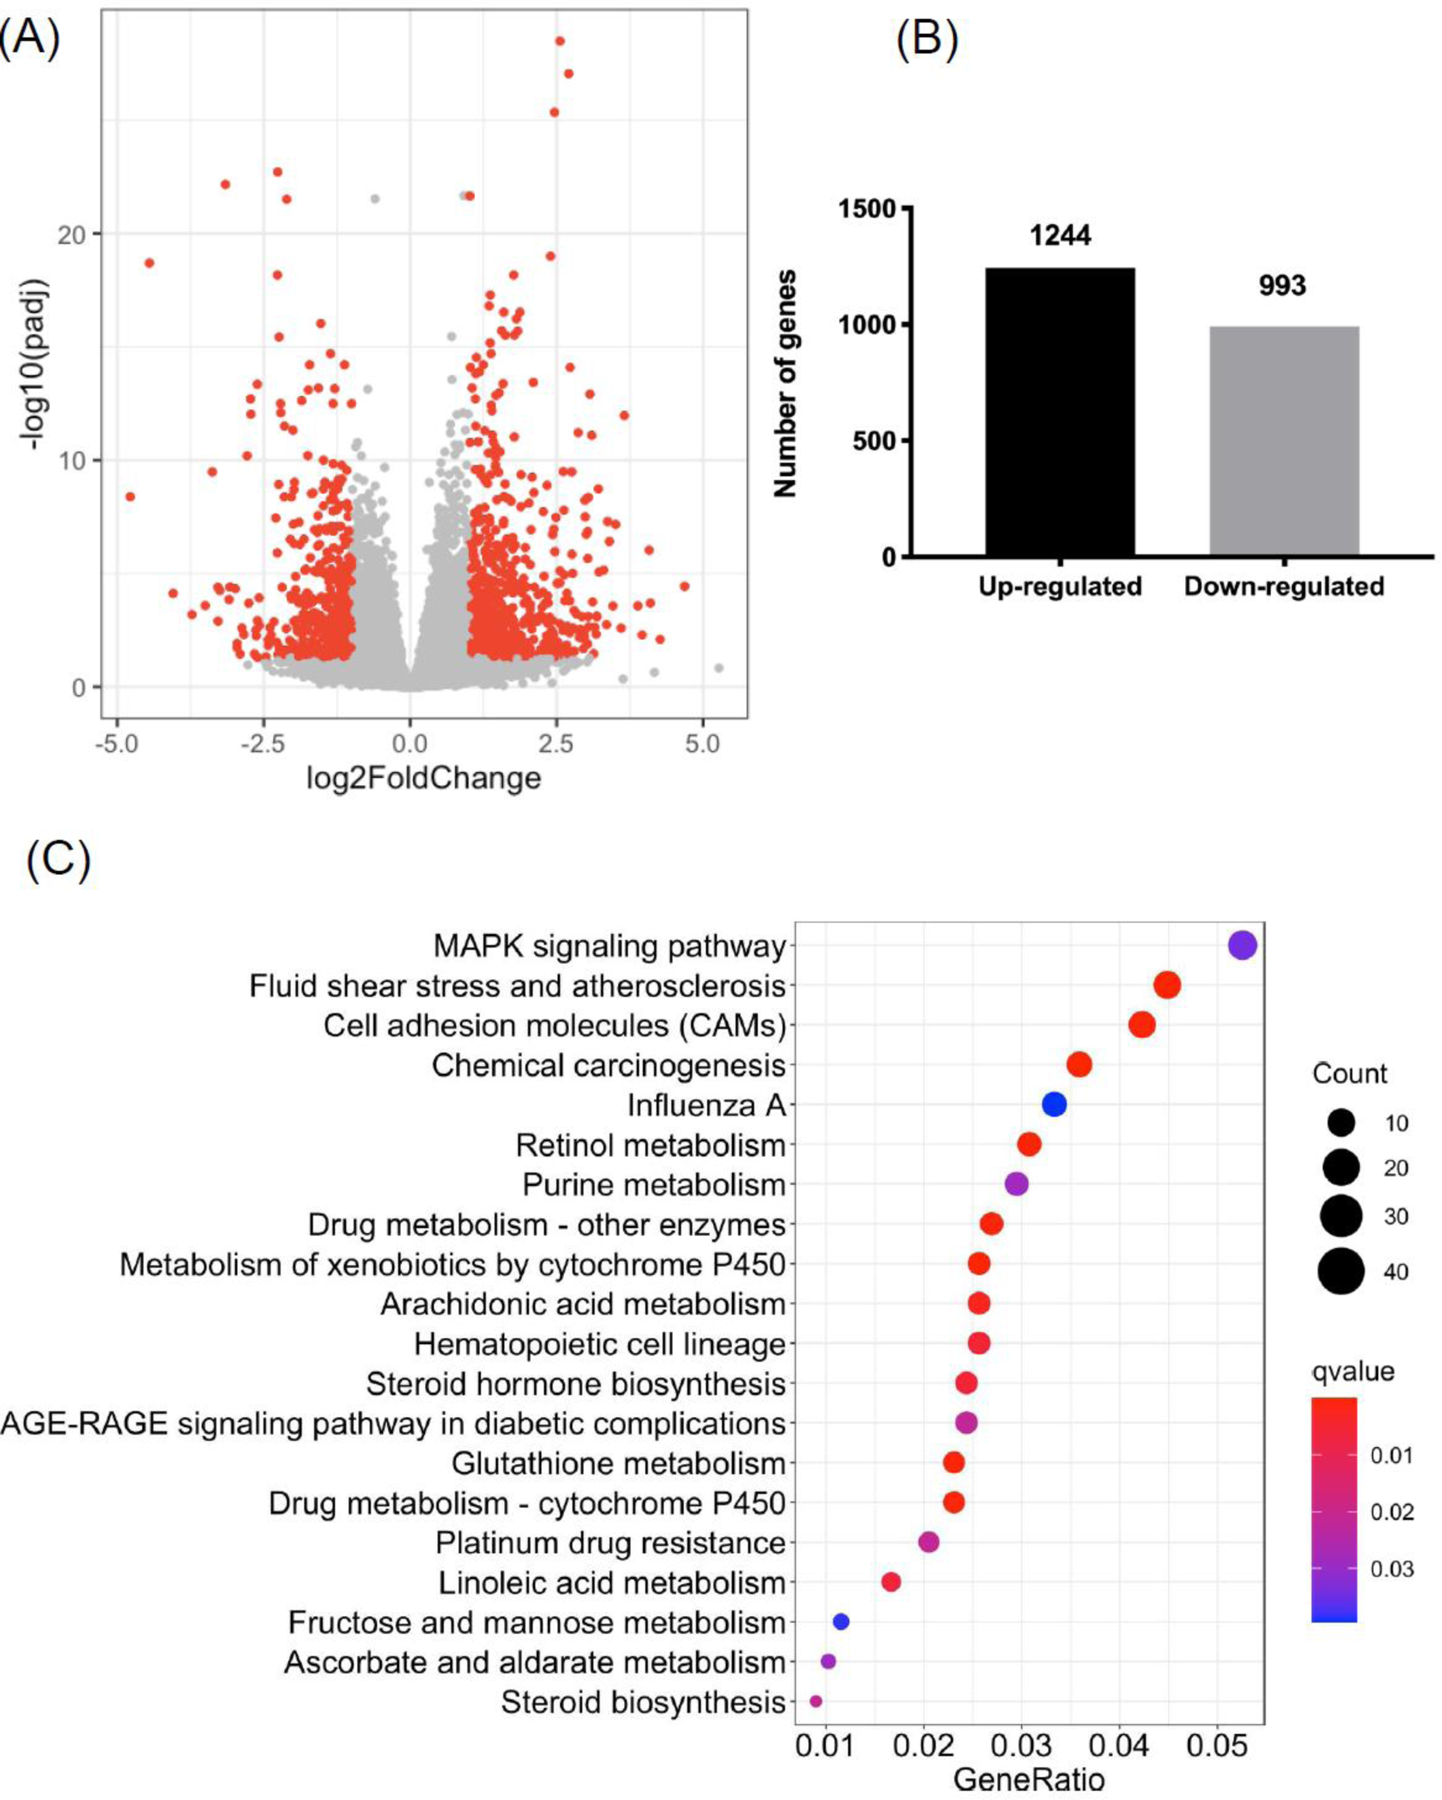
(A) Volcano plot illustrating DEGs in liver between ethanol-fed and control mice (absolute fold change > 2; adjusted P value < 0.05). (B) Number of up- and down-regulated genes in liver in response of ethanol compared with control. (C) Top 20 significant KEGG pathways in ethanol-fed mice compared with controls (q value < 0.05). Control group: n=10; Ethanol group: n=19. For figure 1(B) and 1(C), cutoff for DEGs is absolute fold change > 1.5, adjusted P value < 0.05.