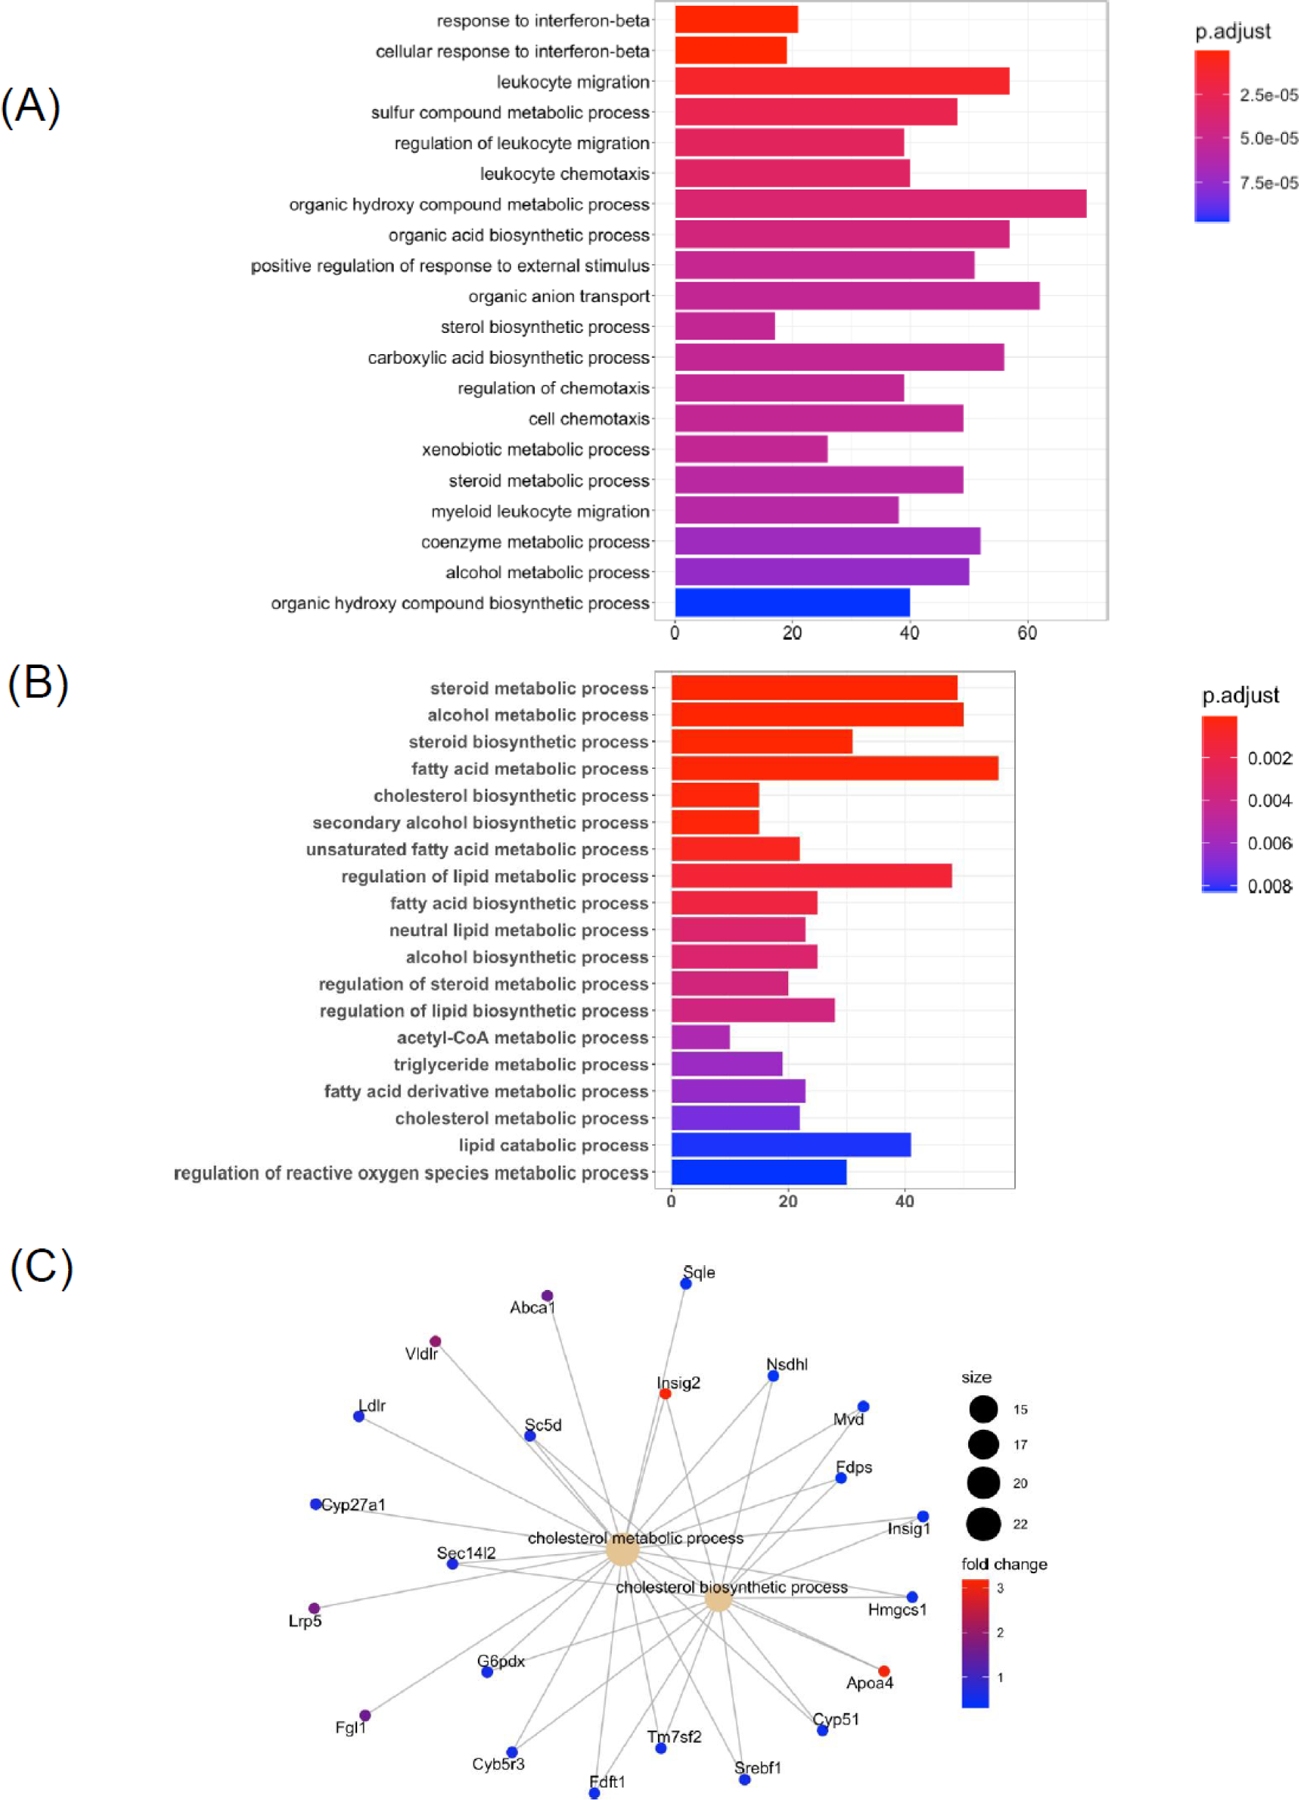
Figure 2. Gene ontology (GO) biological processes and gene-concept networks of cholesterol-associated GO terms in liver in response to chronic plus binge ethanol.

(A) Bar chart of top 20 significant GO terms of liver differentially expressed genes (DEGs) following ethanol treatment compared with controls. (B) Bar chart of selected and significantly different GO terms following chronic plus binge ethanol feeding. (C) Gene-concept networks of cholesterol metabolic process and cholesterol biosynthetic process. Control group: n=10; Ethanol group: n=19. Significant GO terms cutoff: adjusted P value < 0.05.
