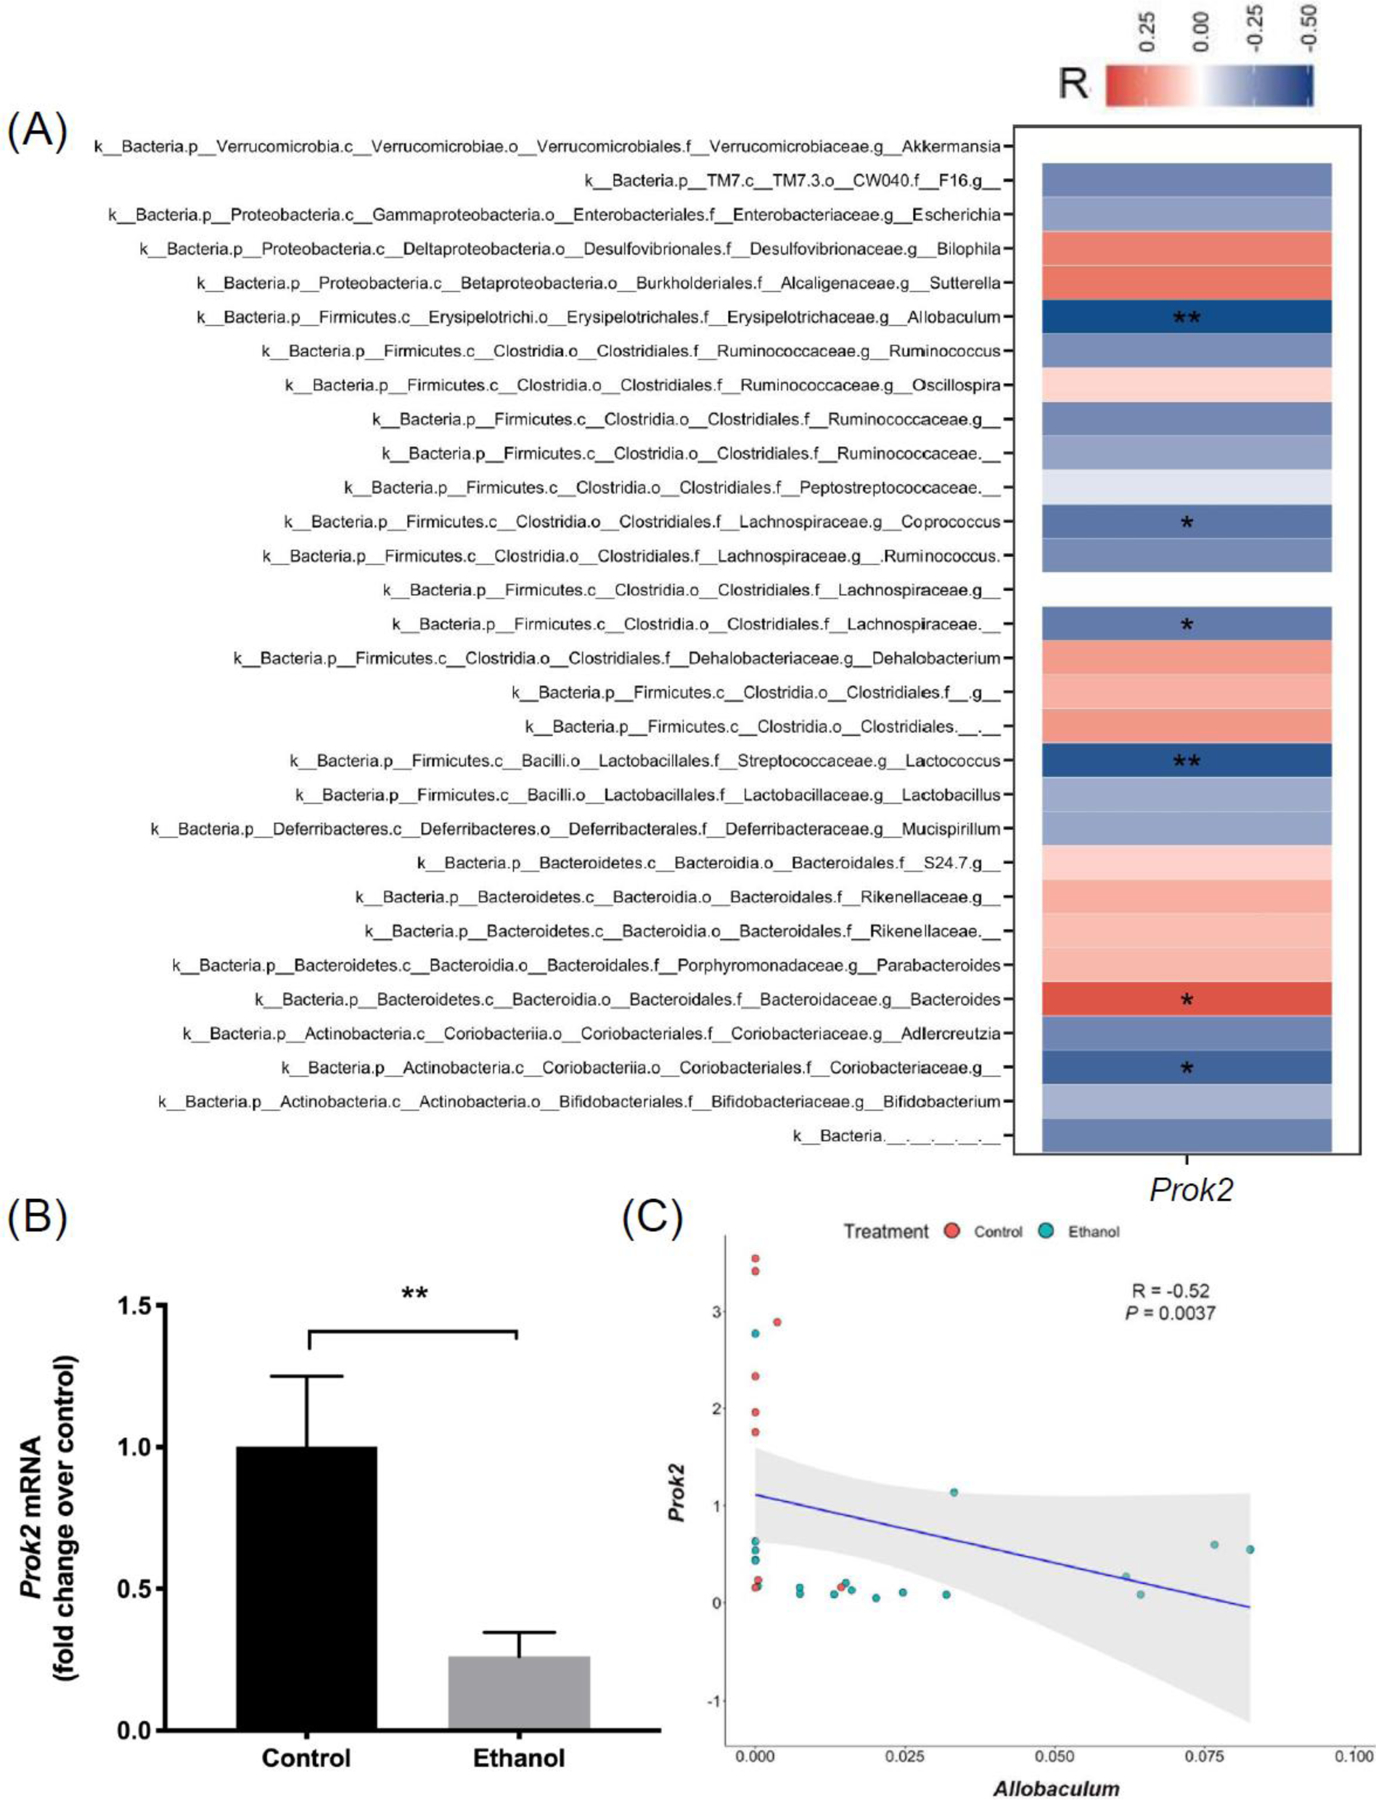
Figure 6. Correlation between ileal Prok2 expression and metagenomic (16S rDNA sequencing) data.

(A) mRNA level of ileal Prok2 in control and ethanol groups (real-time qPCR). (B) Heatmap of Spearman correlation between ileal Prok2 mRNA and the 30 most abundant bacteria at genus level, determined from 16S rDNA gene sequencing. Red color indicates positive correlation, blue color indicates negative correlation. (C) Spearman correlation between ileal Prok2 mRNA and Allobaculum abundance. Control group: n=10; Ethanol group: n=19. *P < 0.05, ****P < 0.0001.
