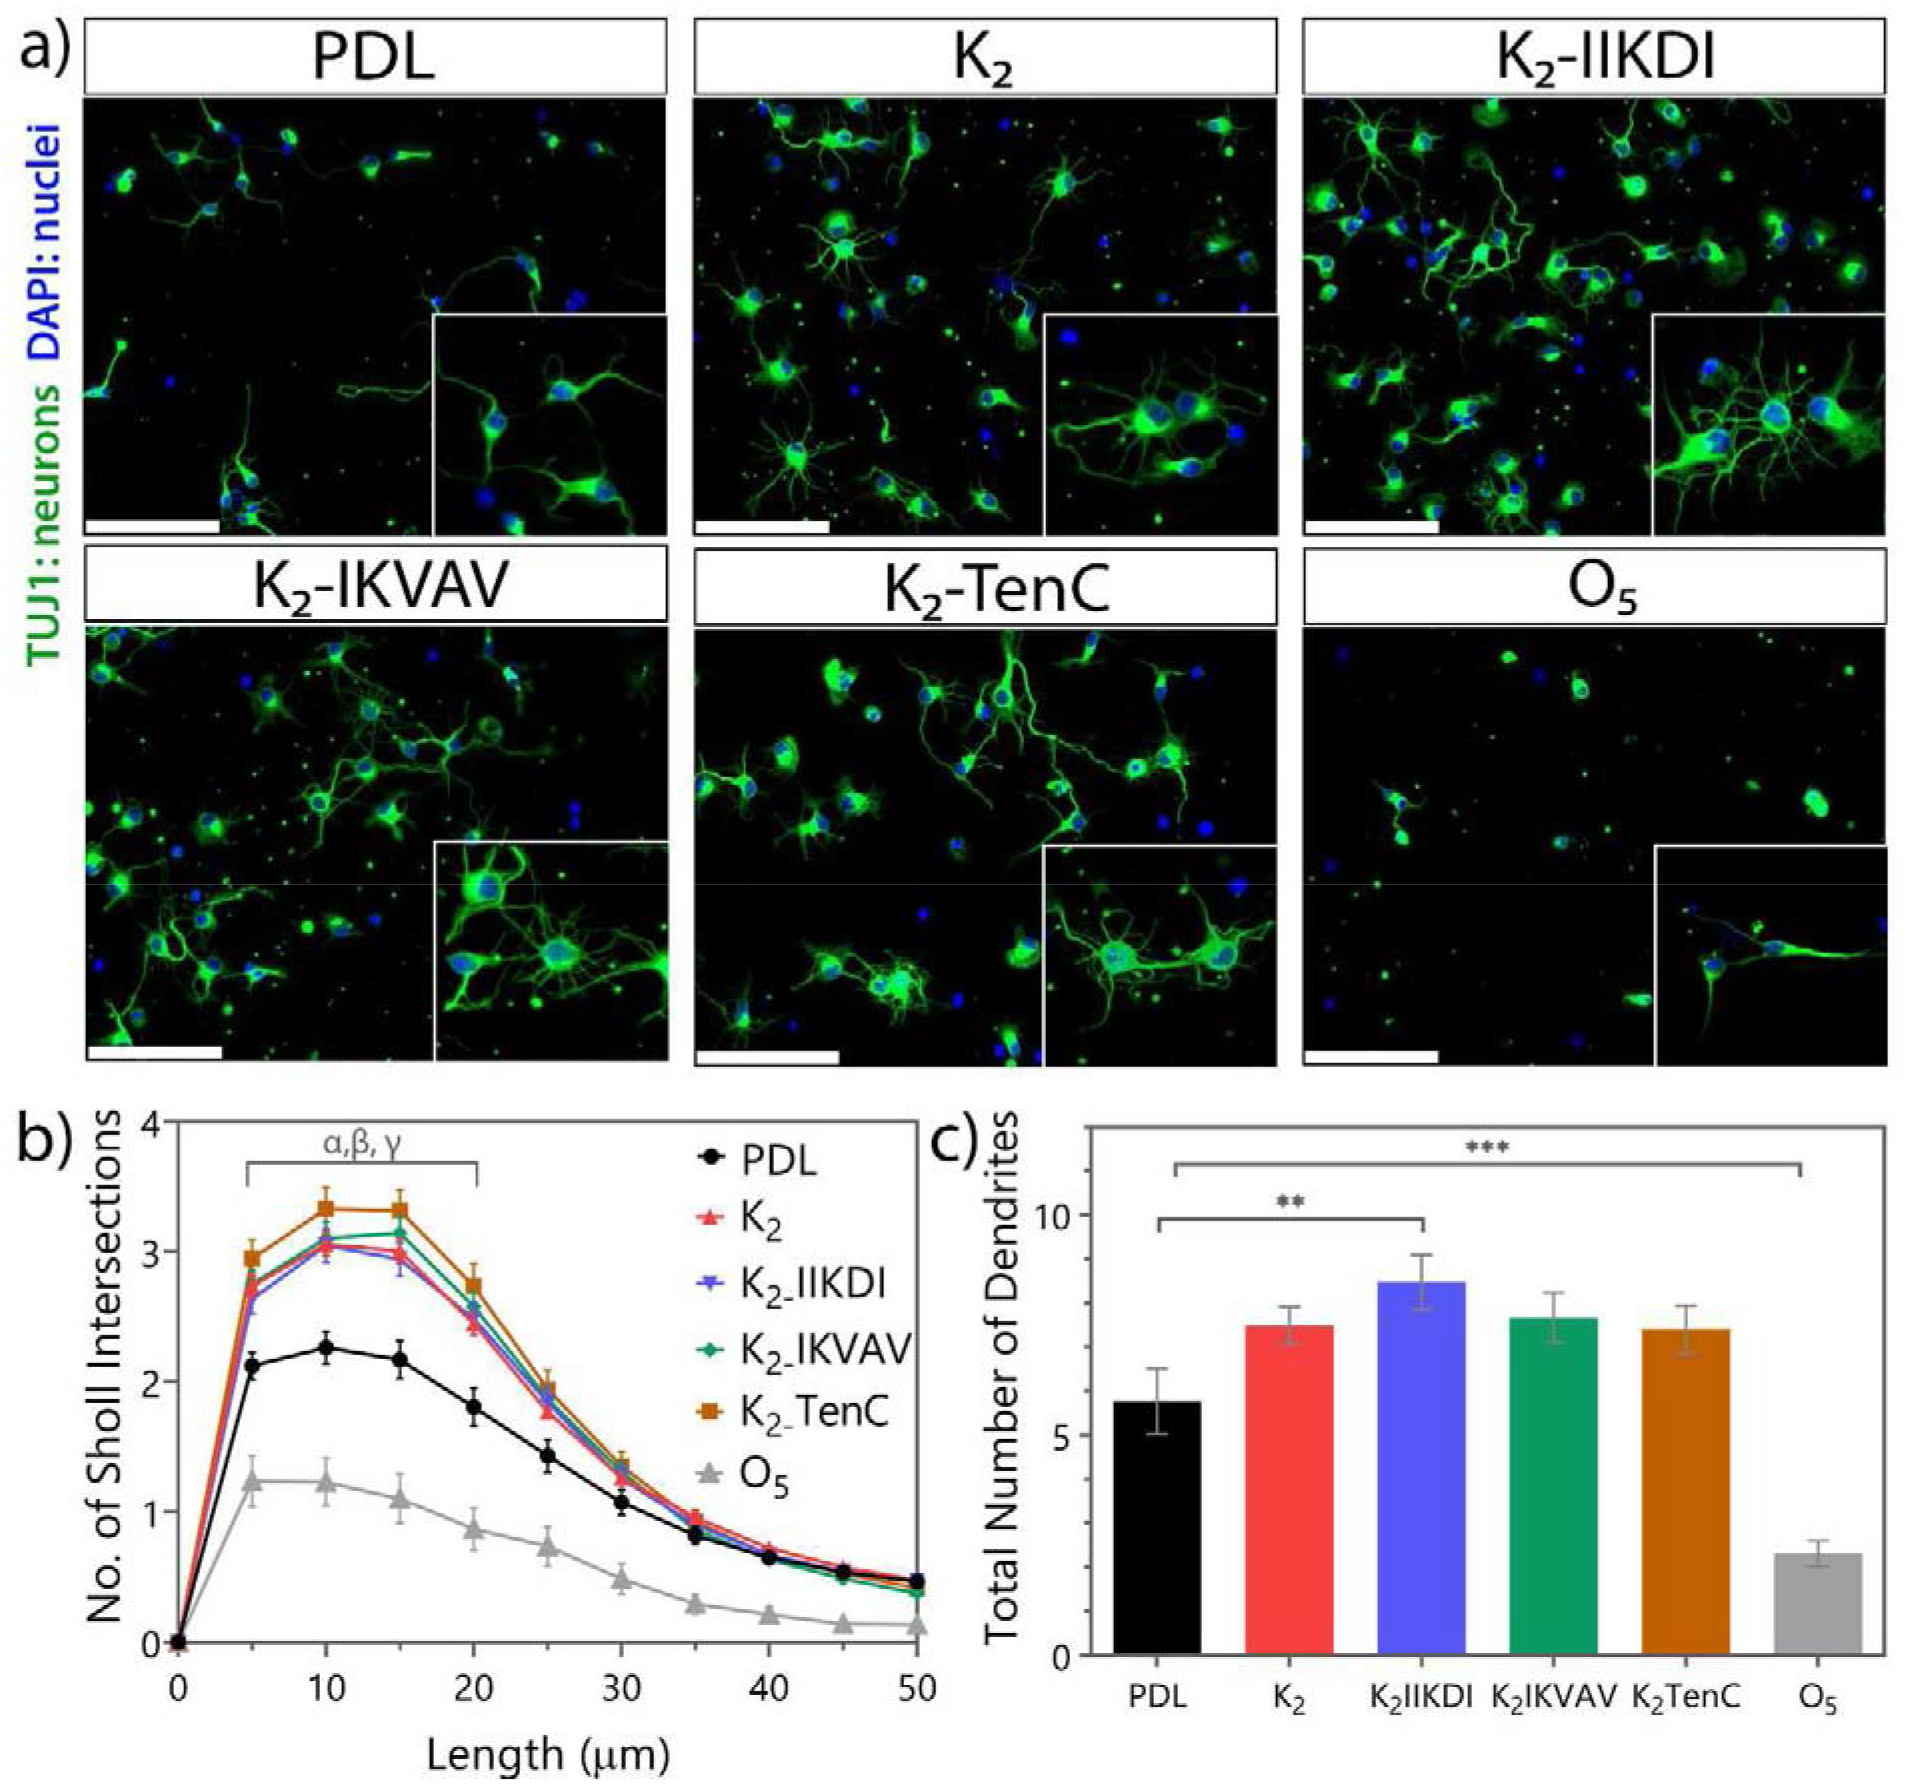
Figure 3.

Primary neuronal culture on peptide-coated coverslips shows differences in neuronal outgrowth. a) Representative images of cortical neurons three days of culture in peptide-coated glass. Scale bar 100 μm. b) Number of Sholl intersections at specific length. Sholl intersections from 5 to 20 μm of neurons cultured in MDPs are significantly different from PDL. α: K2-IIKDI p-value < 0.05, α: K2 and K2-IKVAV p-value < 0.01, γ: K2-TenC and O5 (p-value 0.0001). c) Total number of dendrites per neuron. ** p-value < 0.01, *** p-value 0.0001. Error bars represent SEM n= 24 images from 4 separate experiments.
