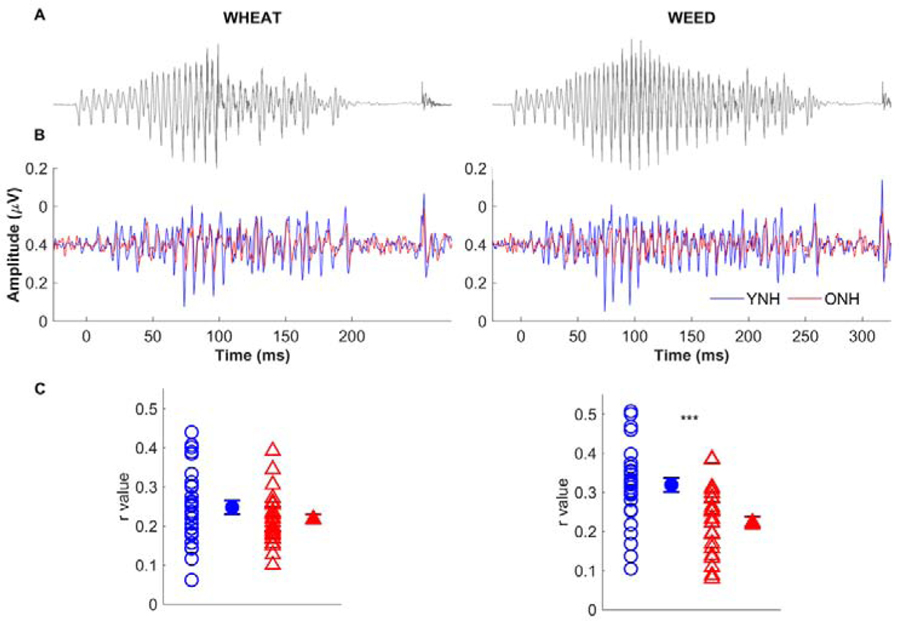
Fig. 5.
Stimulus-to-response correlation ‘r’ values are lower in ONH than in YNH listeners for the word WEED but not for WHEAT. Panel A shows stimulus waveforms that differ only in vowel duration. Panel B shows response waveforms in young normal-hearing (YNH, blue) and older normal-hearing (ONH, red) listeners. A drop in neural synchrony is apparent in the ONH listeners at approximately 185 ms. Panel C displays individual (open symbols) and mean (closed symbols) for YNH (blue circles) and ONH (red triangles) listeners. Error bars: ± 1 standard error. ***p < 0.001. Modified with permission from Roque et al. (2019a).

