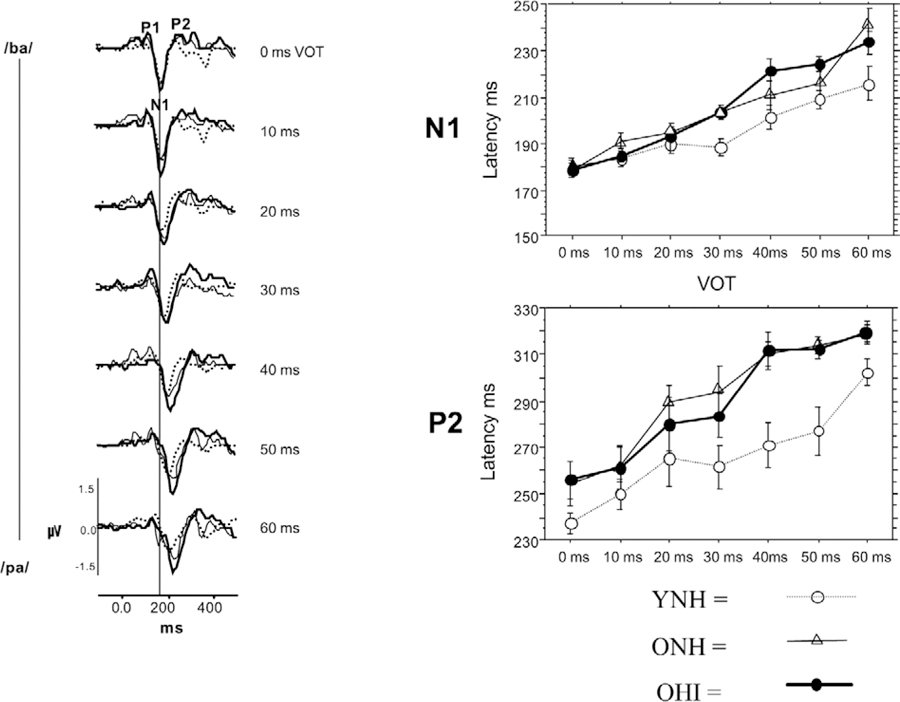
Fig. 6.
Left panel: Group average waveforms show that increasing voice-onset-time (VOT) results in increased latencies of P1, N1, and P2 peaks of the cortical auditory-evoked response. Right panels: N1 and P2 peaks show greater delays with increasing VOTs in older normal-hearing (ONH, filled circles) and older hearing-impaired (OHI, open triangles) listeners compared to young normal-hearing (YNH, open circles) listeners. Error bars: 1 standard error. Used with permission from Tremblay et al. (2003).

