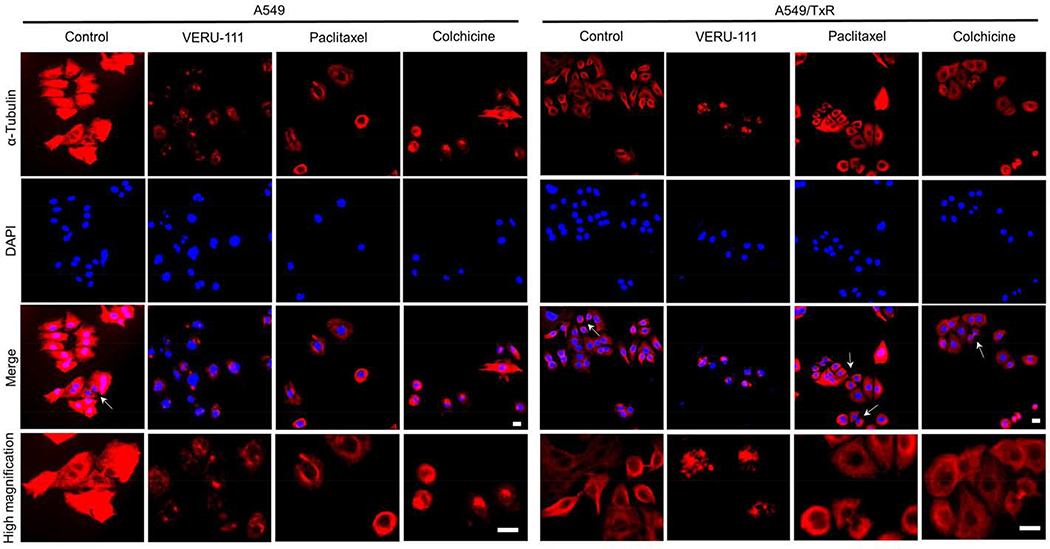
Figure 4:
Immunofluorescence staining showing the microtubules networks were disrupted after treatment with VERU-111, paclitaxel or colchicine compared with control cells. Both A549 and A549/TxR cells were used in this study to evaluate the drug-induced effects (100 nM for 24 h) on microtubules which were visualized with anti-α-tubulin antibody (red) and the nuclei with DAPI staining. The photographs were captured by fluorescence microscopy and the white arrows were pointed for cytokinesis. Scale bar: 20 μm.

