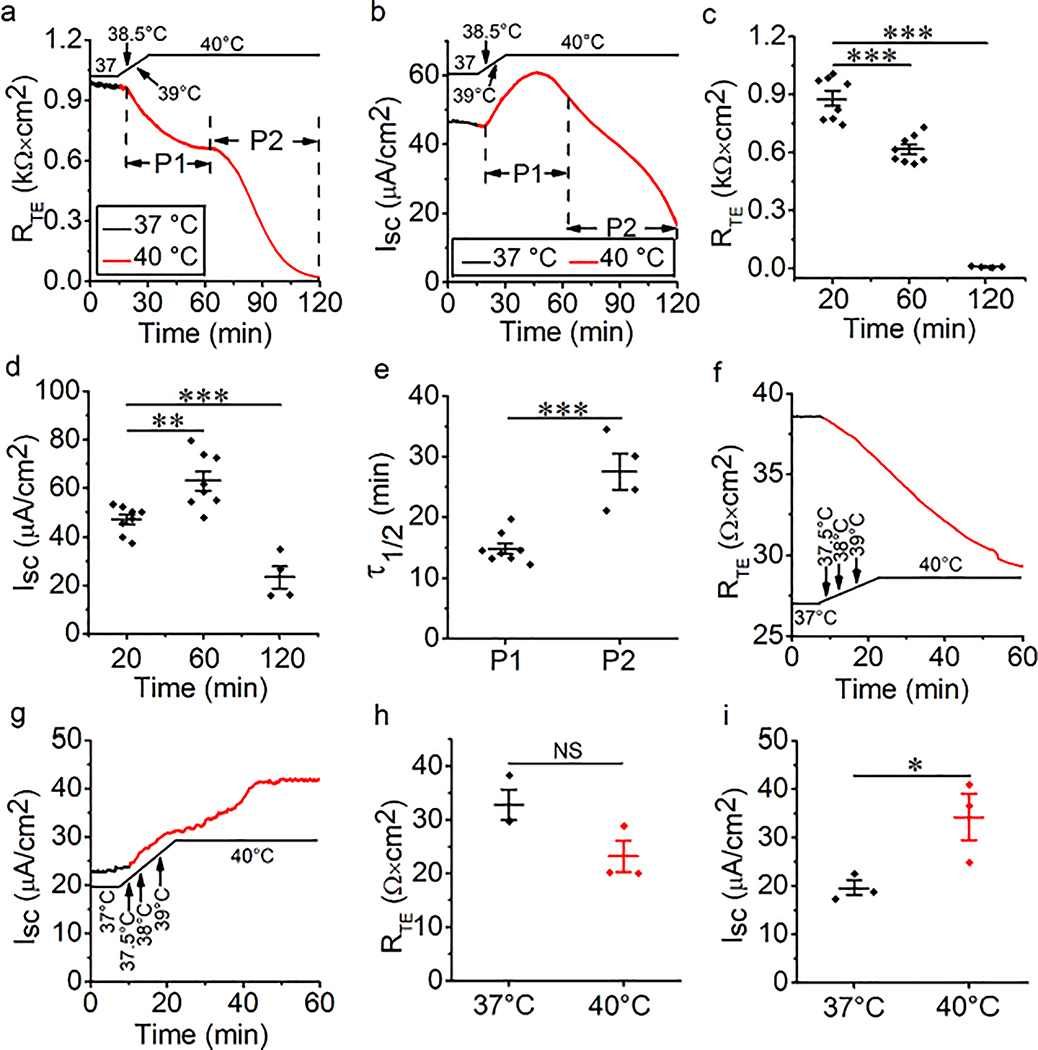
Fig. 1.
Thermal stress alternates bioelectric features in mouse tracheal epithelial (MTE) and human bronchial epithelial (HBE) monolayers. (a) Representative transepithelial resistance (RTE) trace in MTE monolayer mounted on an Ussing chamber setup. RTE was decreased in a two-phase manner (P1 and P2 were labeled) during the temperature of the bath solution was raised to 40°C (red line) from 37°C (black line). When the temperature rose to 38.5°C, the changes in RTE and ISC were observed, and it took 4.7 min for the course from 37°C to 40°C. (b) Short-circuit current (ISC) trace recorded simultaneously in the same MTE monolayer. P1 and P2 of ISC were defined using the RTE time course. ISC was increased at P1 and decreased at P2. (c) Average RTE levels of MTE monolayers at different time points during thermal stress. Student’s t-test. ***P < 0.001. n = 20. (d) Average ISC levels of MTE monolayers. Student’s t-test. ***P < 0.001. n = 20. (e) Time for reducing half of the total RTE (τ1/2). The τ1/2 value was computed by fitting RTE raw data with the ExpDec1 function. (y0 = 0.36 ± 0.04, A = 0.87 ± 0.04 [P1]; y0 = −0.87 ± 0.11, A = 3.22 ± 0.36 [P2]). Student’s t-test. ***P < 0.001. n = 12. (f) Representative RTE trace in HBE monolayer. RTE was decreased during the temperature of the bath solution was elevated to 40°C (red line) from 37°C (black line). (g) ISC trace recorded simultaneously in the same HBE monolayer. ISC was increased to a high and stable level during thermal stress. (h) Average RTE levels of HBE monolayers under the conditions of 37°C and 40°C. Student’s t-test. NS, no significance. n = 6. (i) Average ISC levels of HBE monolayers. Student’s t-test. *P < 0.05. n = 6.

