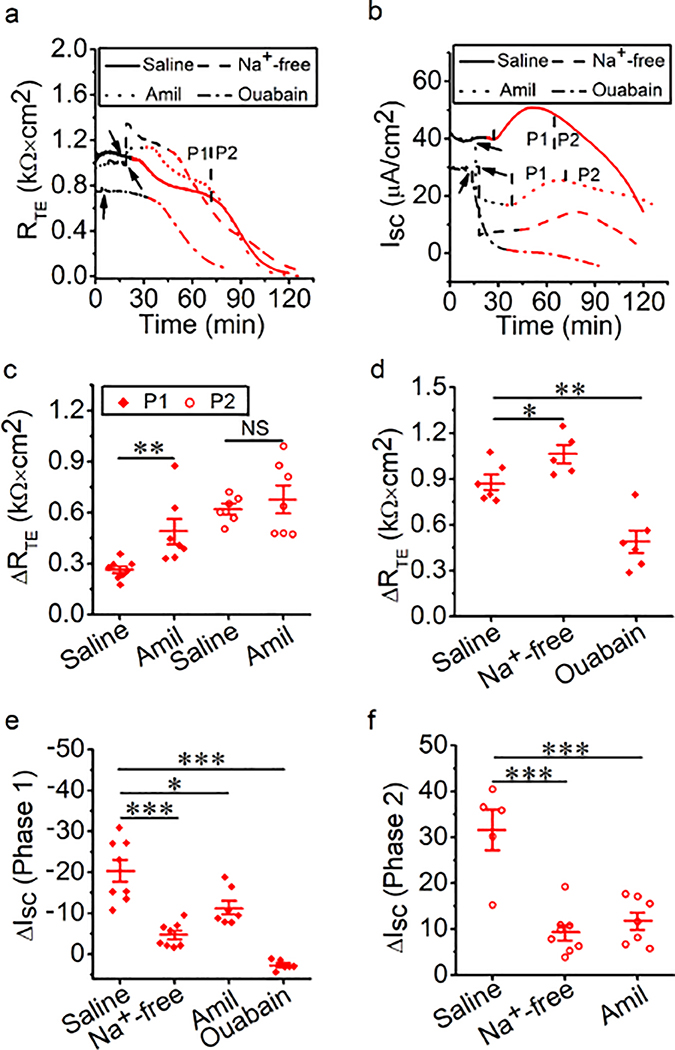
Fig. 2.
Na+ transport mediates thermal stress-induced bioelectric changes in MTE monolayers. (a, b) Representative RTE and ISC traces in the presence of saline bath solution (control group, solid line), Na+-free bath solution (dashed lines), amiloride (Amil, 100 μM, dotted lines), or ouabain (1 mM, dashed-dotted lines). At 37°C (black lines), Na+-free bath solution, amiloride or ouabain was applied at the time pointed by the arrow. And the temperature of the bath solution was elevated to 40°C (red lines). When the temperature rose to 38.5°C, the changes in RTE and ISC were observed. (c) Average thermal stress-sensitive RTE levels (ΔRTE, the difference between the initial RTE and ending RTE within one phase [P1 or P2]). Mann-Whitney U test and Student’s t-test. **P < 0.01. NS, no significance. n = 27. (d) Average thermal stress-sensitive RTE levels (ΔRTE, the difference between the initial RTE and ending RTE during the entire process of thermal stress). Student’s t-test. *P < 0.05 and **P < 0.01. n = 17. (e) Average thermal stress-sensitive ISC levels at P1 (ΔISC, the difference between the basal ISC and the peak ISC at P1). Student’s t-test. *P < 0.05 and ***P < 0.001. n = 29. (f) Average thermal stress-sensitive ISC levels at P2 (ΔISC, the difference between the peak ISC and the ending ISC at P2). Student’s t-test. ***P < 0.001. n = 20.

