Fig. 3.
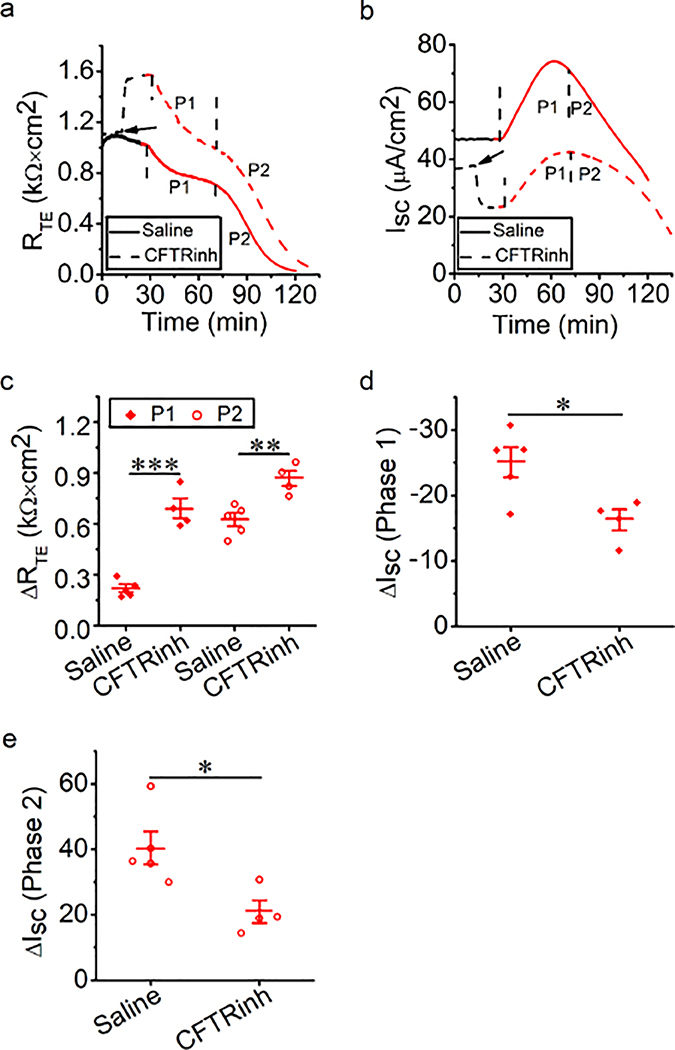
CFTR is involved in thermal stress-induced bioelectric changes in MTE monolayers (a, b) Representative RTE and ISC traces in the presence of saline bath solution (control group, solid line) and CFTRinh-172 (CFTRinh, 20 μM, dashed line). Segments of traces recorded at different bath temperatures were shown as black (37°C) and red lines (40°C). Arrows indicated the time to add CFTRinh-172. When the temperature rose to 38.5°C, the obvious bioelectric changes were observed. (c) Average thermal stress-sensitive RTE levels (ΔRTE, the difference between the initial RTE and ending RTE within one phase [P1 or P2]). Student’s t-test. **P < 0.01 and ***P < 0.001. n = 18. (d) Average thermal stress-sensitive ISC levels at P1 (ΔISC, the difference between the basal ISC and the peak ISC at P1). Student’s t-test. *P < 0.05. n = 9. (e) Average thermal stress-sensitive ISC levels at P2 (ΔISC, the difference between the peak ISC and the ending ISC at P2). Student’s t-test. *P < 0.05. n = 9.

