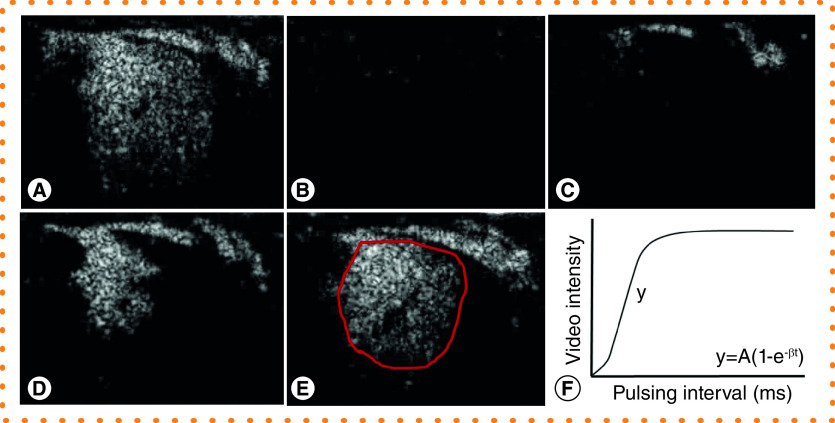
Figure 3. . Quantitative analysis of placental contrast enhanced ultrasound imaging.
(A–E) Time series of still images from an individual maternal spiral artery perfusing one placental cotyledon in a third trimester nonhuman primate study. (A) Premicrobubble destruction. (B) Microbubbles are ‘burst’ by a brief increase in the mechanical index. (C) Visualization of refilling of the maternal spiral artery at 1 s post burst. (D) Perfusion of the intervillous space 4 s post burst. (E) Replenishment at 10 s post burst. (F) Example replenishment-kinetic curve indicating calculation of flux rate (β) from the slope of the curve (y) for a region of interest (red outline in (E)).

