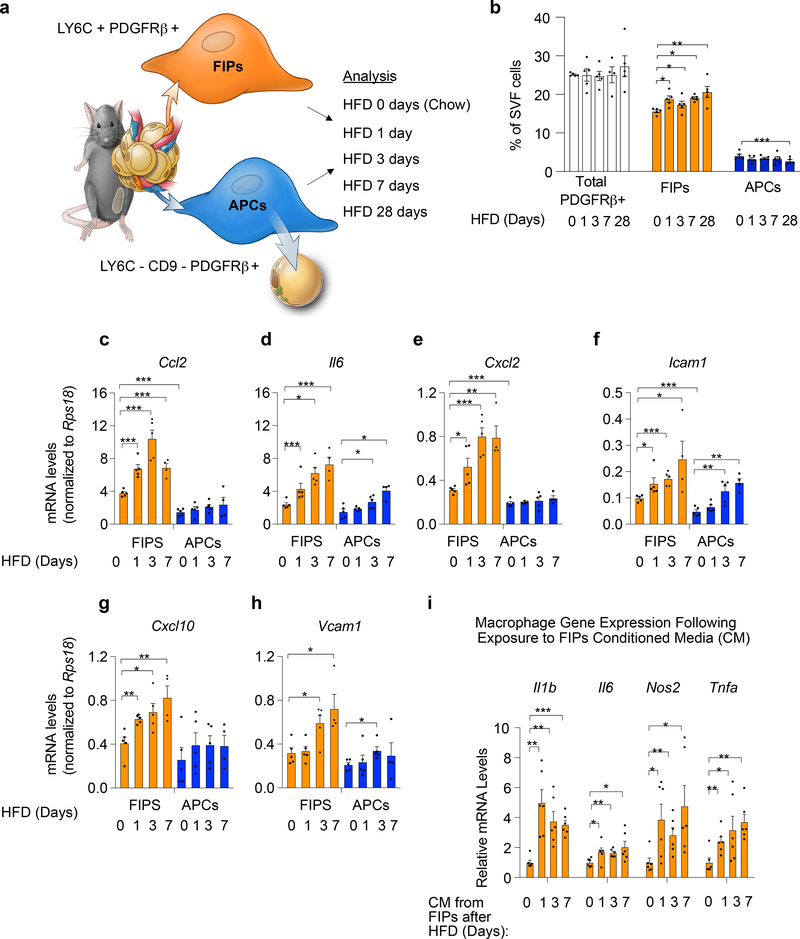
Figure 1. FIPs are activated in association with adipose tissue inflammation.
a) Experimental design: APCs (LY6C- CD9- PDGFRβ+) and FIPs (LY6C+ PDGFRβ+) were isolated by FACS from gonadal WAT obtained from 10 weeks-old male C57BL/6 mice fed a standard chow diet (0 days HFD) or high-fat diet (HFD) for 1 day (HFD 1 day), 3 days (HFD 3 days) or 7 days (HFD 7 days) at 22 °C. Illustration is reproduced from Hepler et al. 5
b) Frequency of total PDGFRβ+ cells and PDGFRβ+ subpopulations within gonadal WAT at the indicated time points (days) following the onset of HFD-feeding. Data is presented as a percentage of all live SVF cells obtained from gonadal WAT.
c-h) Gene expression analysis of FIPs and APCs: mRNA levels of Ccl2 (c), Il6 (d), Cxcl2 (e), Icam1 (f), Cxcl10 (g) and Vcam1 (h) in FIPs and APCs isolated at the indicated time points. Representative data from a single experiment is shown.
Data in panels b-h were reproduced in 3 independent experiments. For representative experiment shown, n = 5 samples for HFD 0 days (chow). n = 5 for HFD 1 day. n = 5 for HFD 3 days. n = 4 for HFD 7 days. n=5 for HFD 28 days. Each sample (n) represents ~3×10⁴ cells sorted from a pool of two fat depots from one mouse.
* denotes p< 0.05, ** denotes p<0.01, and *** denotes p<0.001 by one-way ANOVA.
i) Macrophage activation following exposure to FIPs conditioned media (CM): mRNA levels of genes associated with macrophage activation in cultured bone marrow-derived macrophages (BMDMs) following exposure to indicated FIPs conditioned media for 1.5 hours. n = 6 independent wells of macrophages examined per experiment.
Experiments in panel i were independently repeated 2 times. Representative data form two experiments is shown. * denotes p< 0.05, ** denotes p<0.01, and *** denotes p<0.001 by one-way ANOVA. In all panels, bars represent mean + s.e.m. Each dot represents value of individual measurement (n). Exact p values for each dataset can be found in Source Data Figure 1.

