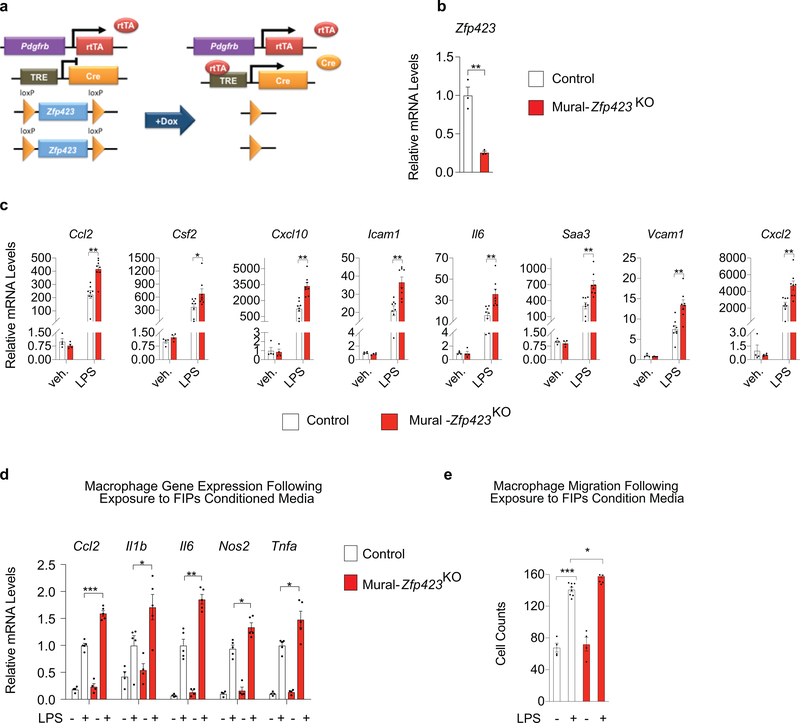
Extended Data Fig. 3: Inactivation of Zfp423 exacerbates FIPs inflammatory responses.
a) Mural-Zfp423KO (PdgfrbrtTA; TRE-Cre; Zfp423loxP/loxP) mice were generated by breeding the PdgfrbrtTA transgenic mice to animals expressing Cre recombinase under the control of the tetracycline-response element (TRE-Cre) and carrying floxed Zfp423 alleles (Zfp423loxP/loxP). Littermates carrying only PdgfrbrtTA and Zfp423loxP/loxP alleles (i.e. Cre−) were used as the control animals (Control). The addition of doxycycline (Dox) leads to inactivation of Zfp423 in Pdgfrb-expressing cells.
b) mRNA levels of Zfp423 in FIPs of Control (n=3) and Mural-Zfp423KO (n=3) mice fed Dox-containing chow diet for 10 days.
c) mRNA levels of indicated pro-inflammatory genes in indicated FIPs treated with vehicle (veh.) (n=4) or 100 ng/ml LPS (n=8) for 2 hours.
d) mRNA levels of genes associated with macrophage activation in cultured BMDMs following exposure to indicated FIPs conditioned media (CM) for 1.5 hours. n=4 (for groups with vehicle treatment) or n=5 (for groups with LPS treatment) independent wells of macrophages examined per experiment.
e) Macrophage migration following exposure to FIPs conditioned media (CM): cell counts of migrated macrophages following exposure to indicated CM for 3 hours. n=4 (for groups with vehicle treatment) or n=9 (for groups with LPS treatment) independent wells of macrophages examined per experiment.
For panels d,e FIPs (isolated from pooled depots of 6–8 mice per genotype) were treated with vehicle or LPS (100 ng/ml) for 2 hours and then incubated in serum-free medium for an additional 24 hours to produce conditioned media.
Experiments in this figure were independently repeated three times. Data in this figure are shown as the mean ± s.e.m., *p< 0.05, **p<0.01 or ***p<0.001 by two-tailed unpaired Student’s t-test (b) or two-way ANOVA (c-e). Exact p values can be found in Source Data Extended Data Figure 3.

