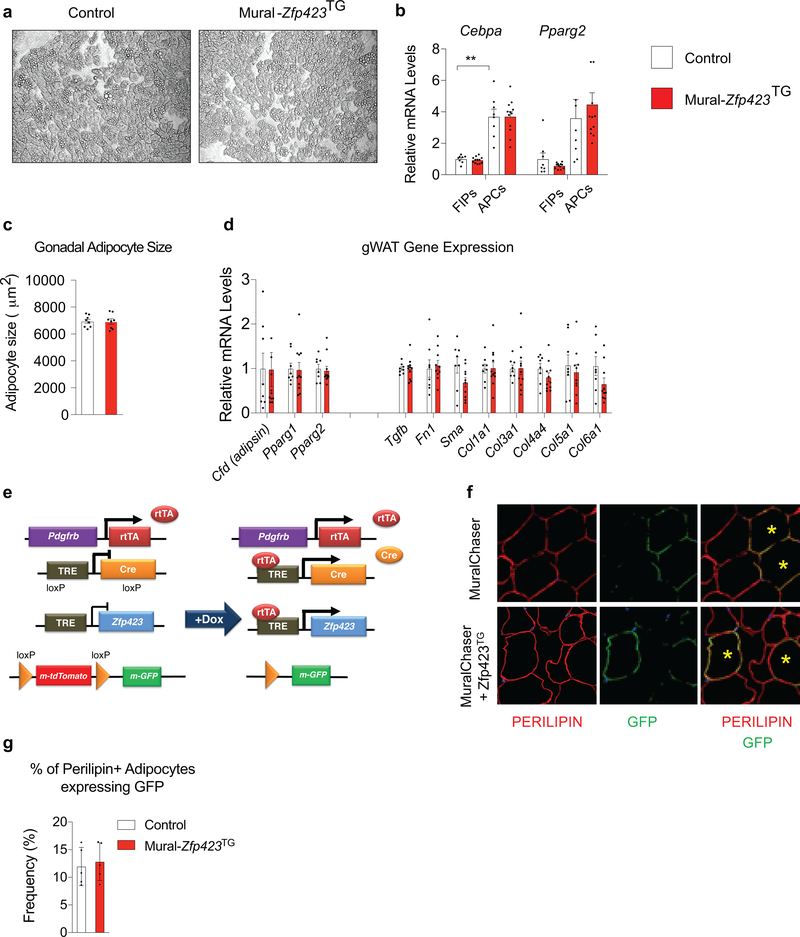
Extended Data Fig. 4: Adipogenesis from PDGFRβ+ progenitors is not impacted in Mural-Zfp423TG mice.
a) Representative 20x magnification images of APCs from gonadal WAT of Control (pooled from 4 mice) and Mural-Zfp423TG (pooled from 4 mice) animals maintained for 8 days in growth media. No overt difference in the degree of spontaneous adipogenesis is observed.
b) mRNA levels of key regulators of adipogenesis (Cebpa and Pparg2) in freshly isolated FIPs and APCs from gonadal WAT of Control (n=8) and Mural-Zfp423TG (n=12) mice after 1-month HFD feeding.
c) Average adipocyte size within gonadal WAT sections of control (n=8) and Mural-Zfp423TG (n=8) mice after 5-month Dox-HFD feeding.
d) mRNA levels of adipocyte-selective genes and fibrogenic genes in whole gonadal WAT of control (n=8) and Mural-Zfp423TG (n=11) mice after 5-month Dox-HFD feeding.
In b-d, bars represent mean ± s.e.m. ** denotes p <0.01 by one-way ANOVA (b).
e) MuralChaser-Zfp423TG (PdgfrbrtTA; TRE-Cre; TRE-Zfp423; Rosa26RmT/mG) mice were generated by reconstituting the Rosa26RmT/mG allele into the Mural-Zfp423TG background. The addition of doxycycline results in overexpression of Zfp423 and indelible labeling of Pdgfrb-expressing cells with mGFP expression.
f) Representative 63x magnification confocal immunofluorescence images of gonadal WAT sections from MuralChaser (PdgfrbrtTA; TRE-Cre; Rosa26RmT/mG) and MuralChaser-Zfp423TG mice after HFD feeding. 8 weeks-old animals were maintained on doxycycline-containing HFD feed for 8 weeks. Sections were stained with anti-PERILIPIN (PERILIPIN; red) and anti-GFP (green) antibodies and counterstained with DAPI (blue; nuclei). Composite images were generated by digital overlay.
g) Quantification of de novo adipogenesis: the frequency of GFP+ PERILIPIN+ cells observed by immunostaining was quantified by assaying ~3000–4000 adipocytes total from 5 mice per genotype. Bars represent mean ± s.e.m.
Exact p values can be found in Source Data Extended Data Figure 4. Data were reproduced two times in independent experiments.

