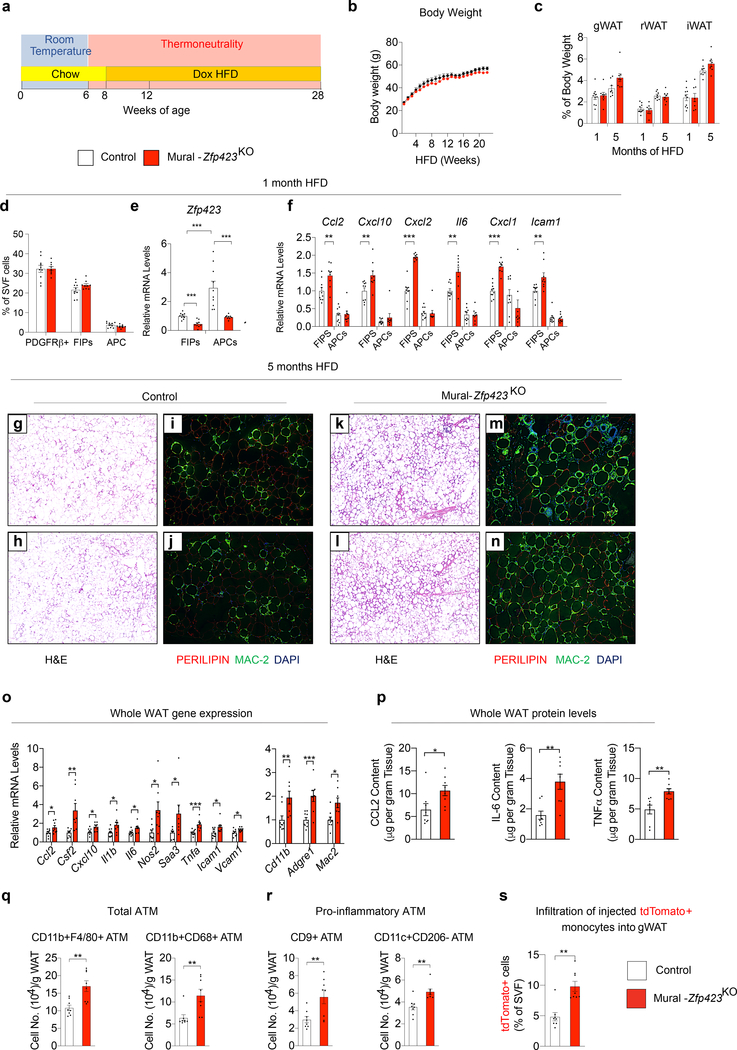
Extended Data Fig. 6: Zfp423 inactivation in PDGFRβ+ cells exacerbates chronic WAT inflammation.
a) Approach: 6 weeks-old mice were preconditioned at thermoneutrality for two weeks then switched to a doxycycline-containing HFD for indicated period.
b) Control (n=8; black) and Mural-Zfp423KO (n=9; red) body weights following the onset of HFD feeding.
c) WAT mass mice after 1 month (Control, n=10; Mural-Zfp423KO, n=8) and 5 months (Control, n=8; Mural-Zfp423KO, n=8) of HFD feeding.
d) Frequency of total PDGFRβ+ cells, FIPs, and APCs within gonadal WAT (gWAT) of Control (n=10) and Mural-Zfp423KO (n=9) mice after 1 month of HFD feeding.
e) Zfp423 mRNA levels within freshly isolated FIPs and APCs from gWAT of Control (n=10) and Mural-Zfp423KO (n=9) mice after 1 month of HFD feeding.
f) Pro-inflammatory gene expression within freshly isolated FIPs and APCs from gWAT of Control (n=10) and Mural-Zfp423KO (n=9) mice after 1 month of HFD feeding.
g,h) 4x magnification images of H&E stained gWAT sections from Control mice maintained on HFD for 5 months.
i,j) 10x magnification images of PERILIPIN (red) and MAC-2 (green) expression within gWAT sections from Control mice maintained on HFD for 5 months.
k,l) 4x magnification images of H&E stained gWAT sections from from Mural-Zfp423KO mice maintained on HFD for 5 months.
m,n) 10x magnification images of PERILIPIN (red) and MAC-2 (green) expression within gWAT sections from Mural-Zfp423KO mice maintained on HFD for 5 months.
o) Pro-inflammatory- and macrophage-selective gene expression in gWAT of Control (n=9) and Mural-Zfp423KO (n=8) mice after 5-months HFD feeding.
p) Protein levels of indicated cytokines in gWAT od Control (n=8) and Mural-Zfp423KO (n=8) mice after 5-months HFD feeding.
q) Frequency of total adipose tissue macrophages (ATMs) within gWAT of Control (n=8) and Mural-Zfp423KO (n=8) mice after 5 months of HFD-feeding.
r) Frequency of pro-inflammatory ATMs within gWAT of Control (n=8) and Mural-Zfp423KO (n=8) mice after 5 months of HFD-feeding.
s) Frequency of tdTomato+ macrophages within gWAT SVF of obese mice following injection of tdTomato+ monocytes. n=8 for Control; n=8 for Mural-Zfp423TG.
Bars represent mean ± s.e.m., *p< 0.05, **p<0.01 or ***p<0.001 by unpaired two-tailed Student’s t-test (o-s) or one-way ANOVA (e, f). Exact p values and numbers of repetitions can be found in Source Extended Data Figure 6.

