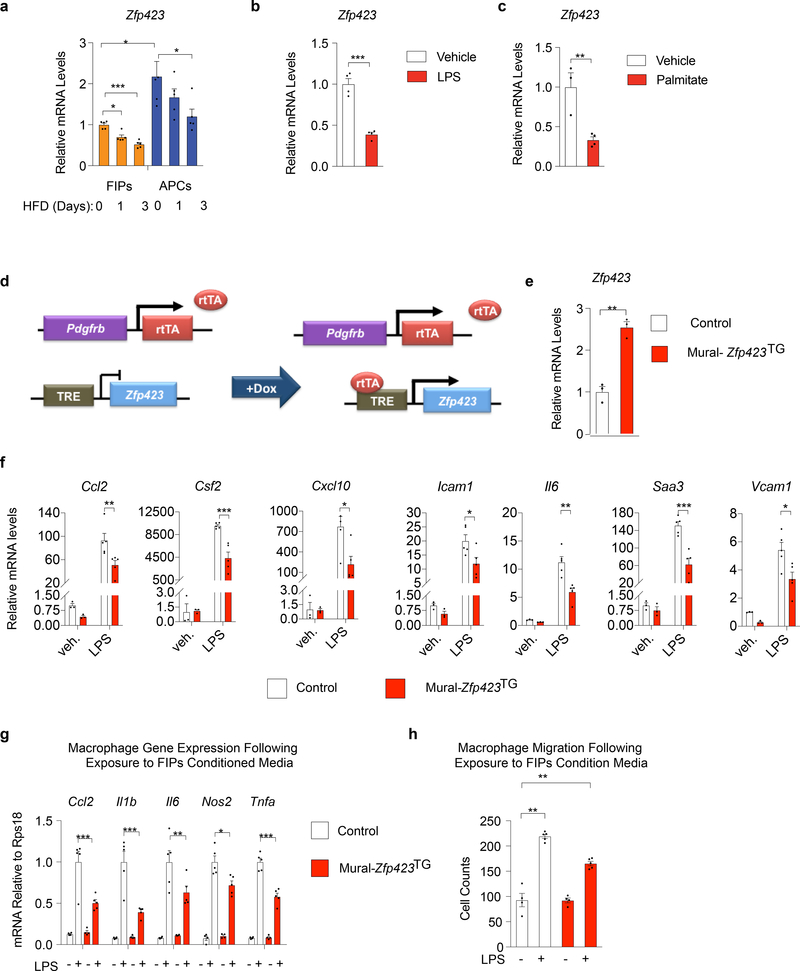
Figure 4. Zfp423 suppresses the pro-inflammatory phenotype of FIPs.
a) mRNA levels of Zfp423 in FIPs and APCs from gWAT of mice after HFD feeding for 0 days (chow) (n=5), 1 day (n=5), and 3 days (n=5).
b) mRNA levels of Zfp423 in primary FIPs cultures treated with vehicle (PBS) (n=4) or 100 ng/ml LPS (n=4) for 6 hours.
c) mRNA levels of Zfp423 in primary FIPs cultures treated with vehicle (BSA) (n=3) or 500 nmol/l palmitate (n=5) for 3 hours.
d) Mural-Zfp423TG (PdgfrbrtTA; TRE-Zfp423) mice were generated by breeding the PdgfrbrtTA transgenics to animals expressing Zfp423 under the control of the tetracycline-response element (TRE-Zfp423). Littermates carrying only PdgfrbrtTA were used as the controls (Control). In the presence of doxycycline, rtTA activates Zfp423 expression in Pdgfrb-expressing cells.
e) mRNA levels of Zfp423 within primary gWAT FIPs cultures from lean Control and Mural-Zfp423TG mice 24 hours after the addition of doxycycline (1μg/ml) to culture medium. FIPs were isolated from pooled depots from 5 mice and then plated immediately into triplicate wells for analysis (n=3 per group).
f) mRNA levels of indicated genes in primary FIPs cultures treated with vehicle (veh.) (n=3) or 100 ng/ml LPS (n=5) for 2 hours.
g) mRNA levels of genes associated with macrophage activation in cultured BMDMs following exposure to indicated FIPs conditioned media (CM) for 1.5 hours.
h) Macrophage migration following exposure to FIPs conditioned media (CM): cell counts of migrated macrophages following exposure to indicated CM for 3 hours.
For panels g,h FIPs (isolated from pooled depots of 6–8 mice per genotype) were treated with vehicle or LPS (100 ng/ml) for 2 hours and then incubated in serum-free medium for an additional 24 hours to produce conditioned media. n=4 (for groups with vehicle treatment) or n=5 (for groups with LPS treatment) independent wells of macrophages examined per experiment.
Experiments were independently repeated three times (a-c,e,f) or twice (g,h). Data in this figure are shown as the mean ± s.e.m., *p< 0.05, **p<0.01 or ***p<0.001 by two-tailed unpaired Student’s t-test (b,c), one-way ANOVA (a) or two-way ANOVA (f-h). Exact p values can be found in Source Data Figure 4.

