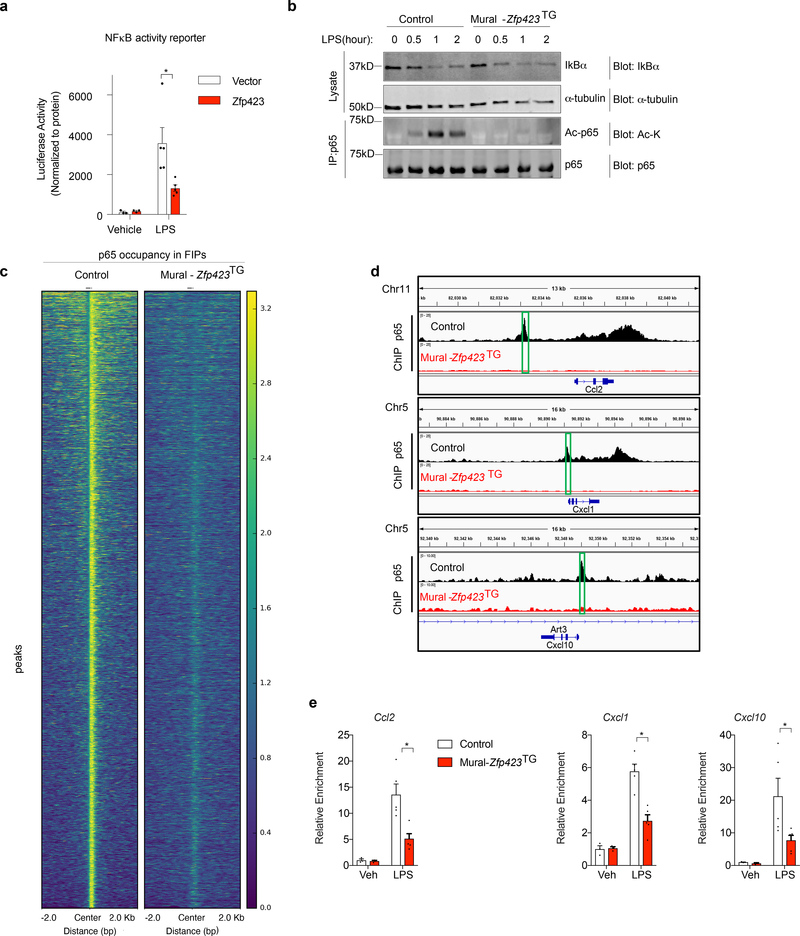
Figure 7. ZFP423 suppresses the DNA-binding capacity and activity of NFκB in FIPs.
a) NFκB-dependent luciferase gene reporter activity in 293-TLR4 cells co-transfected with Zfp423-expressing vector (Zfp423) or empty vector (Vector). Cells were treated with LPS (100ng/ml) (n=5 per group) or vehicle (PBS) (n=3 per group) for 8 hours prior to harvest.
b) Western blot analysis of IκBα, acetylated lysine (Ac-K), and total p65 levels in whole cell lysates or p65 immunoprecipitates from Control and Mural-Zfp423TG FIPs treated with LPS (100 ng/ml) for indicated times. α-tubulin was used as an internal control for protein loading.
c) Heat map illustrating p65-occupied regions in Control and Mural-Zfp423TG FIPs following LPS treatment.
d) p65 enrichment at Ccl2, Cxcl1 and Cxcl10 loci in Control and Mural-Zfp423TG FIPs treated with 100 ng/ml LPS for 2 hours. Green boxes indicate the putative p65 binding motif (GGGRNYYYCC) containing regions targeted by ChIP-qPCR primers.
e) Confirmation of ChIP-seq data by ChIP-PCR. qPCR analysis of p65 occupancy at indicated loci in Control and Mural-Zfp423TG FIPs treated with 100ng/ml LPS for 2 hours. PCR primers spanning the green boxed regions indicated in panel d were used. n= 3 for vehicle group; n=5 for LPS group. Each sample (n) represents individual p65 chromatin immunoprecipitation from ~1,000,000 cells of 8 mice.
For a,e, data are shown as the mean ± s.e.m., * denotes p<0.05 by by two-way ANOVA. Exact p values, numbers of repetitions, and uncropped western blots, can be found in Source Data Figure 7.

