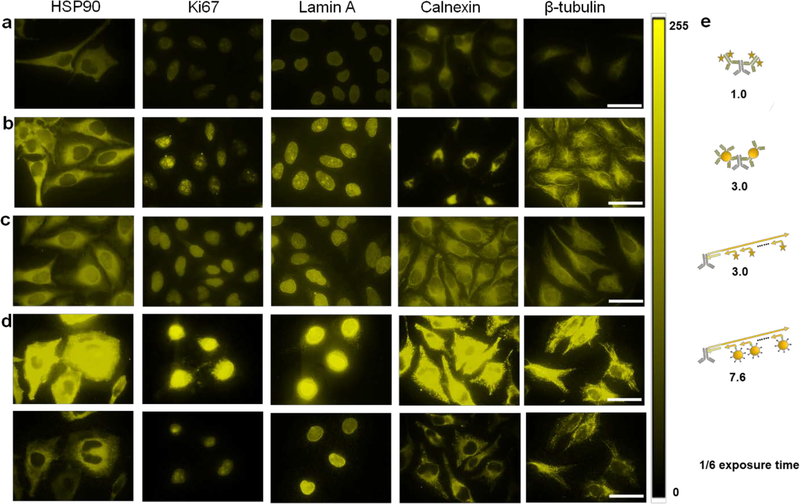
Figure 1. Comparison of IHC using various types of IHC.
a) Conventional two-step IHC using organic dye-labeled 2’Ab, b) conventional two-step IHC using QD-labeled 2’Ab, c) SABER technology using organic dye-labeled imager strands, and d) SABER technology using QD-labeled imager strands. The imaging protocols are described in Supplementary Information. Five model targets representing antigens in both the cytoplasm and nucleus are HSP90, Ki-67, Lamin A, Calnexin, and β-tubulin, from left to right. The organic dye is Alexa Fluor 555 emitting at 580 nm, and the QDs emit at 585 nm. The staining across the four types of IHC showed similar patterns, confirming the staining specificity. For quantitative comparison, images were captured with a 100x objective and a Qcolor5 CCD with constant exposure times, and the results were analyzed with Image J. The images were false-colored and presented in a LUT scaled from 0–255. e) Schematic illustration of how methods b), c), and d) improve staining brightness over method a), the conventional two-step staining using organic dye-labeled 2’Ab (which already has an amplification mechanism because multiple 2’Abs can bind to each 1’Ab and the 2’Abs often have multiple fluorophores), by 3.0, 3.0, and 7.6 folds, respectively. The fluorescence intensities from randomly selected cells (>35 for all samples) were measured. At the camera exposure times optimal for visual presentation in a), b), and c), the fluorescence intensity of QD-SABER in d) was too bright and saturated the detector (top panels). The bottom panels show the same images obtained with the exposure time shortened by 6 times. Scale bar, 50 μm. Control experiments without the primary antibodies were also performed to confirm the QD-SABER staining specificity (Supplementary Figure S2). Non-specific binding from QD-oligo was largely negligible. Since the high-magnification images shown here have a limited number of cells, additional views are also provided in Supplementary Figure S2.

