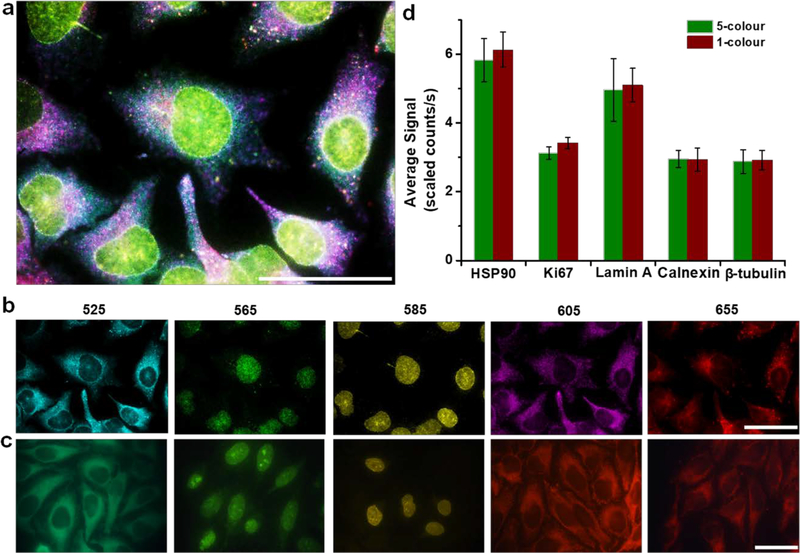
Figure 3. Multiplexed QD-SABER staining of HSP90, Ki-67, Lamin A, Calnexin, and β-tubulin.
a) A reconstructed false-color composite image from parallel multiplexed staining (see Panel b). b) False-colored individual channels obtained with HSI for clear visualization of target intracellular location and distribution (from left to right, QD emitting fluorescence peaked at 525, 565, 585, 605 and 655 nm). The staining patterns and intensities are consistent with c) single-color staining conducted with color-matched QD-imager probes. These single-color images were obtained with a true-color CCD. d) Bar plots of the fluorescence intensity of the stained biomarkers after applying the QD brightness correction factors. The error bars represent s.d. of the average staining intensity between three different fields of view on the same specimen. The Nuance image analysis software was employed to measure the fluorescence intensity of individual QD signal intensity. Scale bar, 50 μm.

