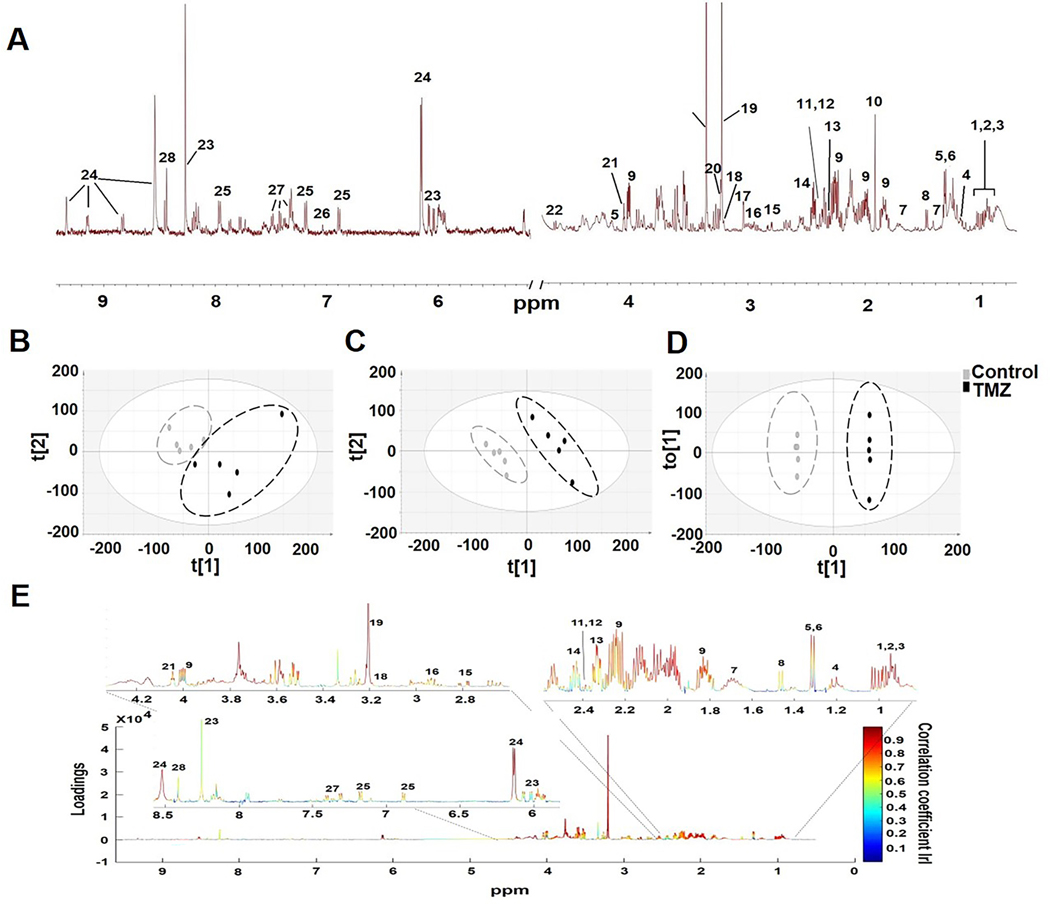
Fig.2:
(A) A typical 1H MRS spectrum of NHAIDHmut cell line. Metabolites are identified as follows: 1.Isoleucine, 2.Leucine, 3.Valine, 4.3-hydroxybutyrate, 5.Lactate, 6.Threonine, 7.Lysine, 8.Alanine, 9.2-hydroxyglutarate, 10.Acetate, 11.Pyruvate, 12.Succinate, 13. Glutamate, 14.Glutamine, 15.Aspartate, 16.Glutathione, 17.Creatine, 18.Choline, 19.Phosphocholine, 20.Glycerophosphocholine, 21.Myo-inositol, 22.Glucose, 23.ATP/ADP/AMP, 24.NAD/NADP+, 25.Tyrosine, 26.Histidine, 27.Phenylalanine, 28.Formate. (B) Two-dimensional scatter plots of PCA, (C) PLS-DA and (D) OPLS-DA show discrimination between control and TMZ-treated groups. (E) Color map representing S-line plot identifies metabolites with correlation coefficient values >±0.6 responsible for discriminating TMZ-treated and control cells.

