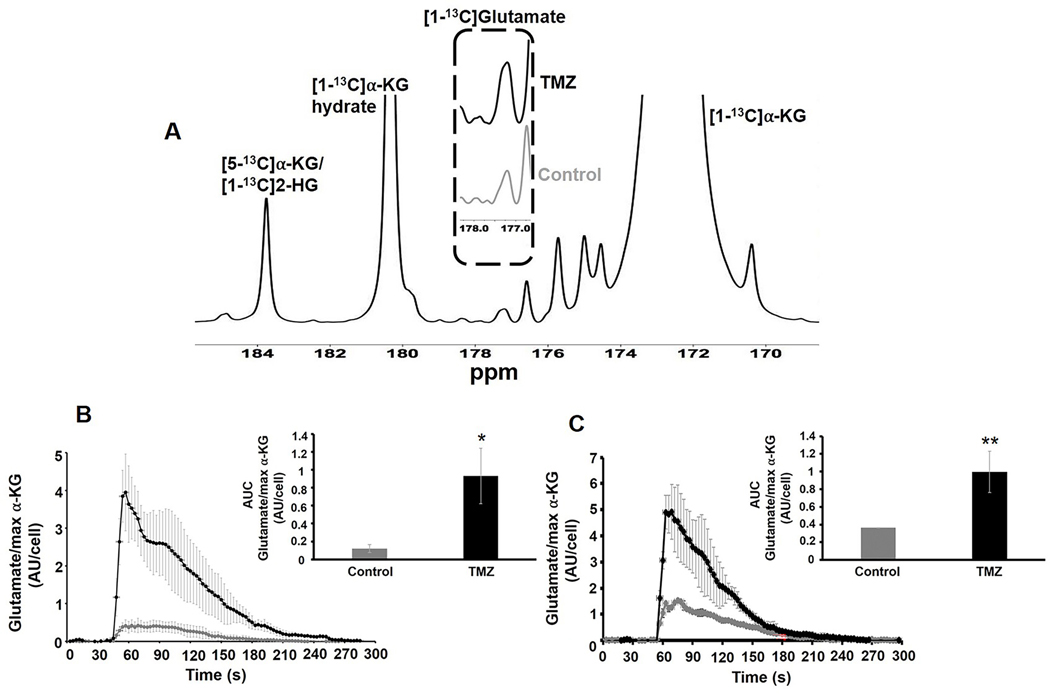
Fig.7:
(A) Representative sum spectrum of 13C MRS data from live cells showing the metabolism of hyperpolarized [1-13C]α-ketoglutarate. The dotted region compares glutamate production in NHAIDHmut cell line treated with TMZ or DMSO for 72h. [1-13C]αKG: [1-13C]α-ketoglutarate, [1-13C]αKG Hydrate: [1-13C]α-ketoglutarate hydrate. (B) Temporal evolution and quantification (insert) of production of hyperpolarized [1-13C]glutamate in NHAIDHmut cell line. (C) Temporal evolution and quantification (insert) of production of hyperpolarized [1-13C]glutamate in U87IDHmut cell line. *p-value<0.05, **p-value<0.01.

