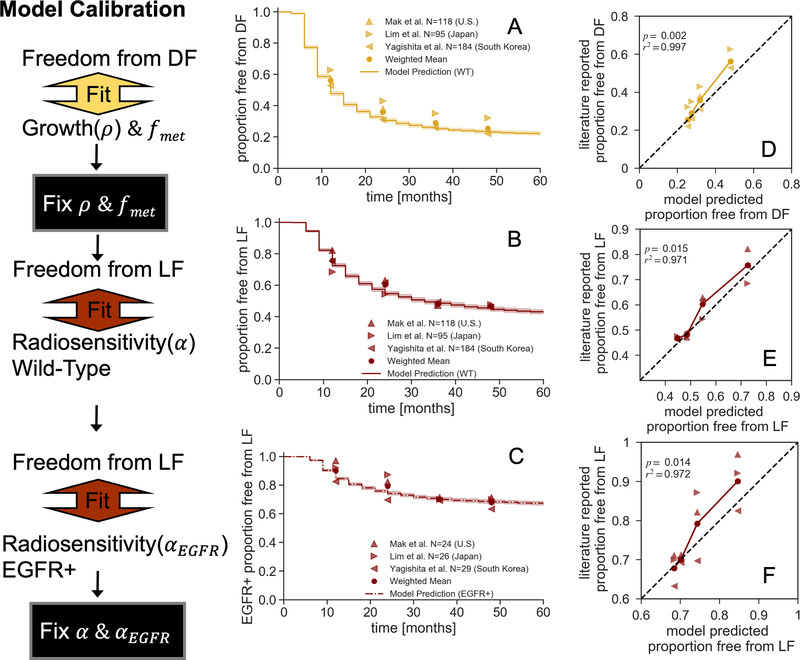
Figure 2 – Model Calibration:
(A-C) Simulated freedom from distant (A) and local (B, WT and C, EGFR-mutant) failure Kaplan-Meier curves using the calibrated model parameters. (D-F) Corresponding model predicted versus literature reported failure rates at 1, 2, 3, and 4 yr. time points. The solid line represents the model predicted versus the weighted mean of literature reported failures, with corresponding linear regression and summary statistics. The black dashed line represents unity.

