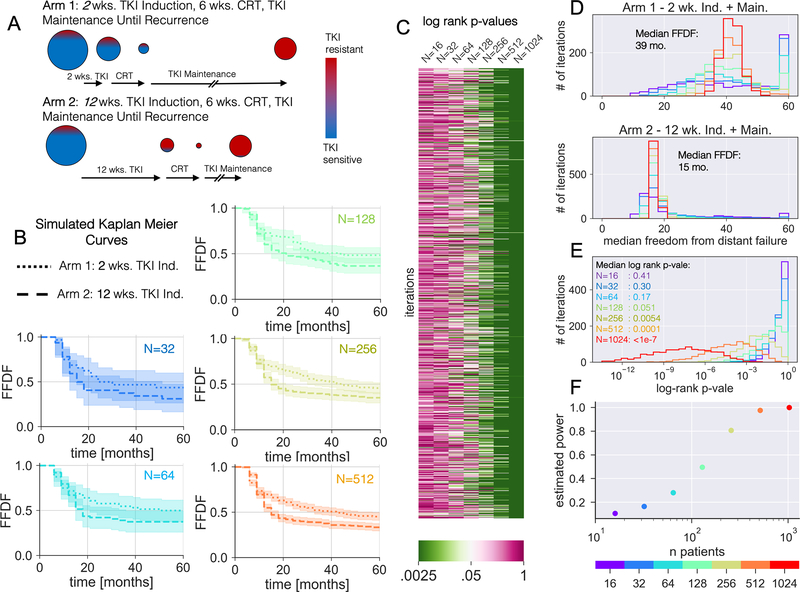
Figure 5 – Simulated in-silico Induction Trial:
(A) Illustration of the differential evolution of the TKI resistant and sensitive populations for a given tumor burden between a short 2 wk. and long 12 wk. induction length. When CRT is done after a significant TKI induction period, the tumor shrinks with the targeted drug killing the TKI sensitive cells (blue), but with more TKI resistant (red) cells at the time of CRT, increasing the chance of a late TKI resistant recurrence if CRT isn’t curative. (B) Simulated FFDF K-M curves for 2 wk. versus 12 wk. induction lengths with increasing number of simulated patients. Each curve corresponds to the iteration with the median log-rank p-vale. (C) A heatmap of log rank p-values testing statistical difference between the 2 wk. versus 12 wk. FFDF K-M curves for 1000 iterations of the simulation at each sample size. (D) Histograms of the median FFDF for the 1000 iterations of the 2 wk. and 12 wk. induction simulations at each sample size. (E) Histogram of the log rank p-value between the 2 wk. versus 12 wk. induction simulations at each sample size. (F) Estimated statistical power as a function of sample size. Here statistical power was estimated as the fraction of iteration resulting in a p-value<0.05.

