Figure 1.

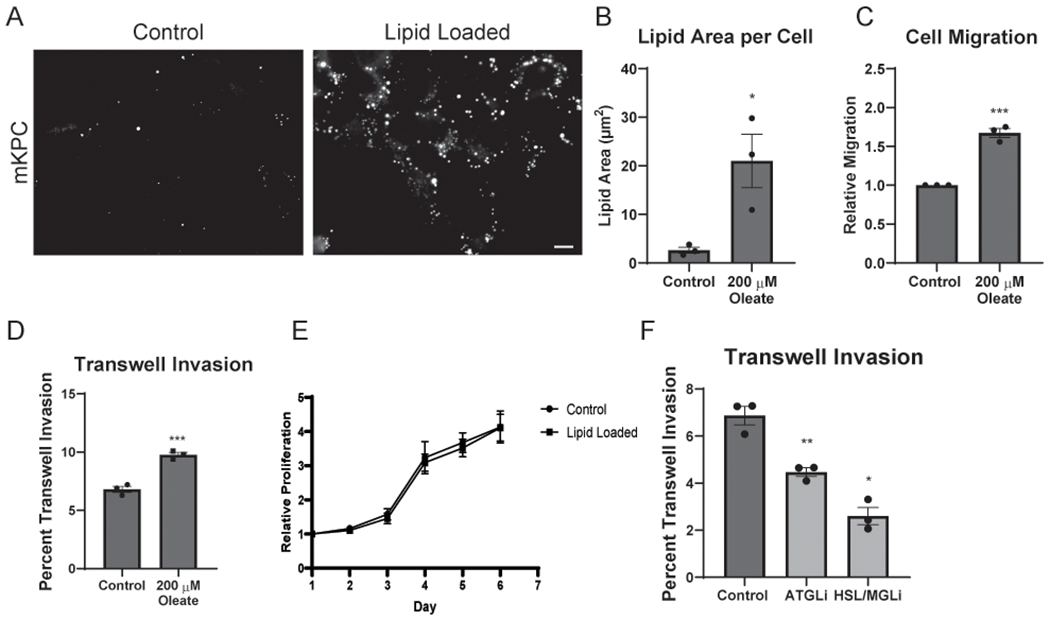
Excess lipid promotes PDAC invasion and migration through lipolysis. A, Control and oleic acid (OA) loaded (200 μM) mKPC cells were visualized by staining for LDs using Oil Red O (ORO). Scale bar, 10 μm. B, Quantitation of total LD area per cell from the conditions in (A). >125 cells scored in at least five fields for 3 independent biological replicates. C, Quantitation of distance migrated of control and OA-loaded mKPC cells in a wound healing assay over 12 hours. 10 measurements of three fields for 3 independent biological replicates represented. D, Quantitation of control and OA-loaded mKPC cells in a transwell invasion assay. Cells invaded for 16 hours through a Matrigel-coated filter toward high-serum media. >300 cells scored in each of 3 independent biological replicates. E, Quantitation of control and OA-loaded mKPC cell proliferation over the indicated number of days. 8 independent biological replicates, normalized to Day 1 for each experiment. F, Quantitation of control or drug-treated mKPC cells in a transwell invasion assay. Cells attached for 2 hours prior to drug treatment, and invaded for 14 hours. 10 μM Atglistatin (ATGLi) and 10 μM CAY 10499 (HSL/MGLi). >300 cells scored in each of 3 independent biological replicates. Graphs indicate mean ± SEM, analyzed by Student’s t-test. *p < 0.05, **p < 0.01, ***p < 0.001.
