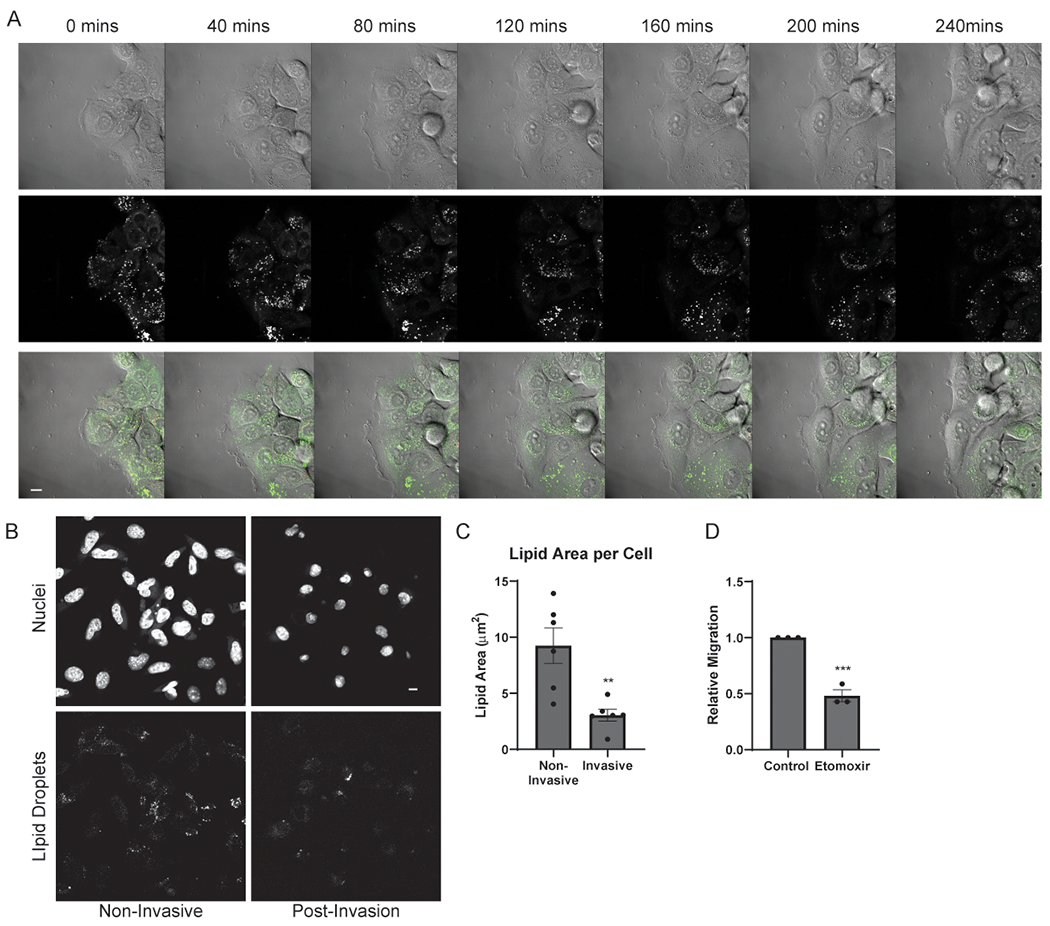
Figure 2.

Lipid droplets are catabolized during invasive migration. A, Still images taken from Supplemental Video 1 depicting Panc04.03 cells at indicated time points migrating in a wound healing assay, with LDs visualized by BODIPY. Brightfield, lipid droplets (white), and composite images are shown. Scale bar, 10 μm. B, Representative images of LDs in mKPC cells in an invasion assay and pre-loaded with OA (200 μM). Non-Invasive cells (left) did not invade, whereas Invasive cells (right) did invade and were imaged on the bottom of the transwell. Cells were stained for nuclei (Hoechst, top) and LDs (ORO, bottom). Scale bar, 10 μm. C, Quantitation of lipid area per cell from (B). >50 cells scored in at least five fields from 6 independent biological replicates. D, Migration quantitation of control or etomoxir-treated (10 μM) mKPC cells. >10 measurements of 3 fields for 3 independent biological replicates shown. Graphs indicate mean ± SEM data, analyzed by Student’s t-test. **p < 0.01, ***p < 0.001.
