
Figure 5.
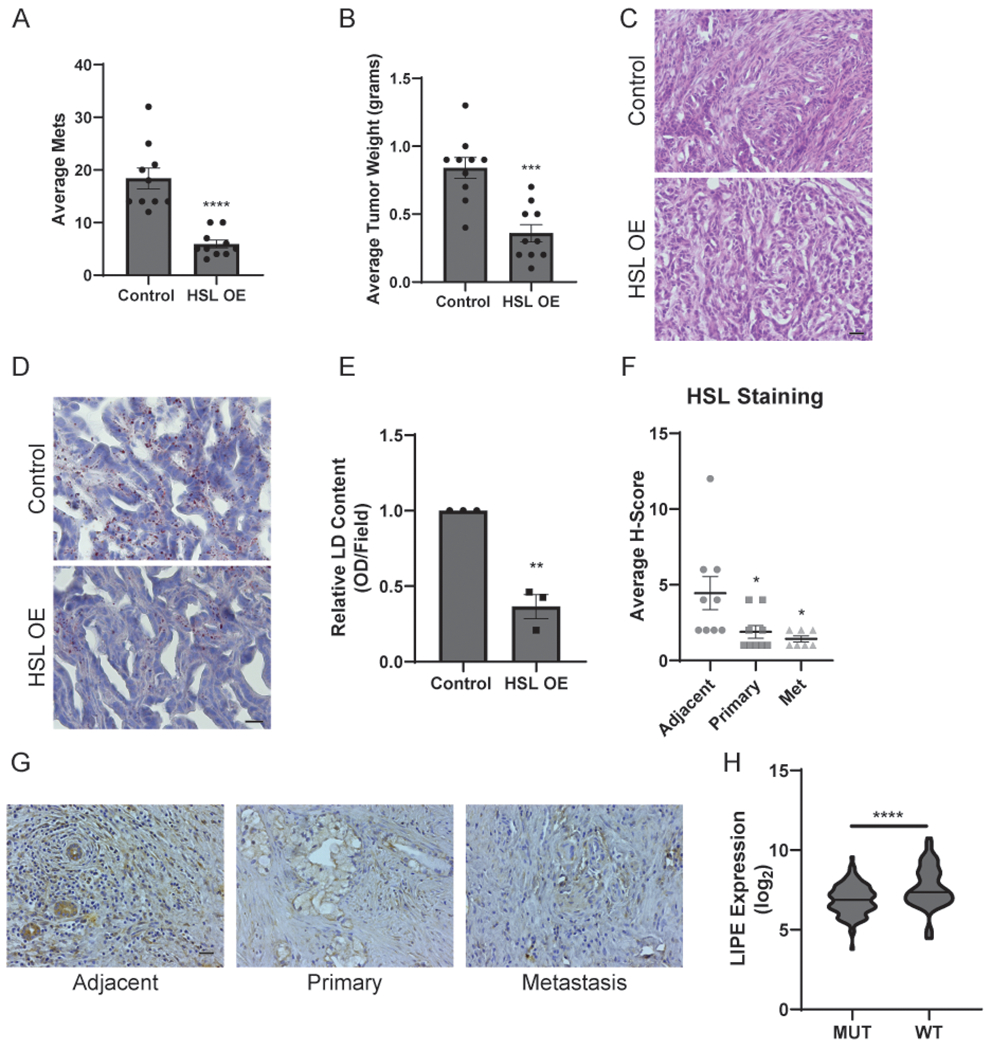
HSL regulates metastasis in vivo. A, The average total number of metastases from C57BL/6 mice following pancreatic orthotopic injections with mKPC cells constitutively overexpressing HSL or a vector control. n=10 mice per group. B, Average weights of the primary tumors isolated from the experiment described in (A). C, H&E staining of primary tumor sections isolated from the experiment described in (A). Scale bar, 20 μm. D, LD staining of primary tumor sections isolated from the experiment described in (A) using ORO and Hematoxylin as counterstain. Scale bar, 10 μm. E, Quantitation of histological sections stained for lipid droplets and depicted in (D). Data represent the relative change in the optical density (OD) of lipid content visualized by ORO staining in three distinct fields from 3 independent biological replicates. F, Immunohistochemistry analysis of patient-matched human pancreatic tissue sections stained for HSL. Data represent adjacent normal, primary tumor, and metastatic tissues isolated from each patient. G, Representative immunohistochemistry images of the tissues described in (F). Scale bar, 20 μm. Graphs indicate mean ± SEM and analyzed by Student’s t-test. H, Analysis of the TCGA-Pancreatic Cancer dataset comparing LIPE (HSL) gene expression in tumors with wild-type or mutant KRAS. Mean log2 expression values are indicated by a dashed line and significance was determined by a Mann-Whitney U test. *p < 0.05, **p < 0.01, ***p < 0.001, ****p < 0.0001.