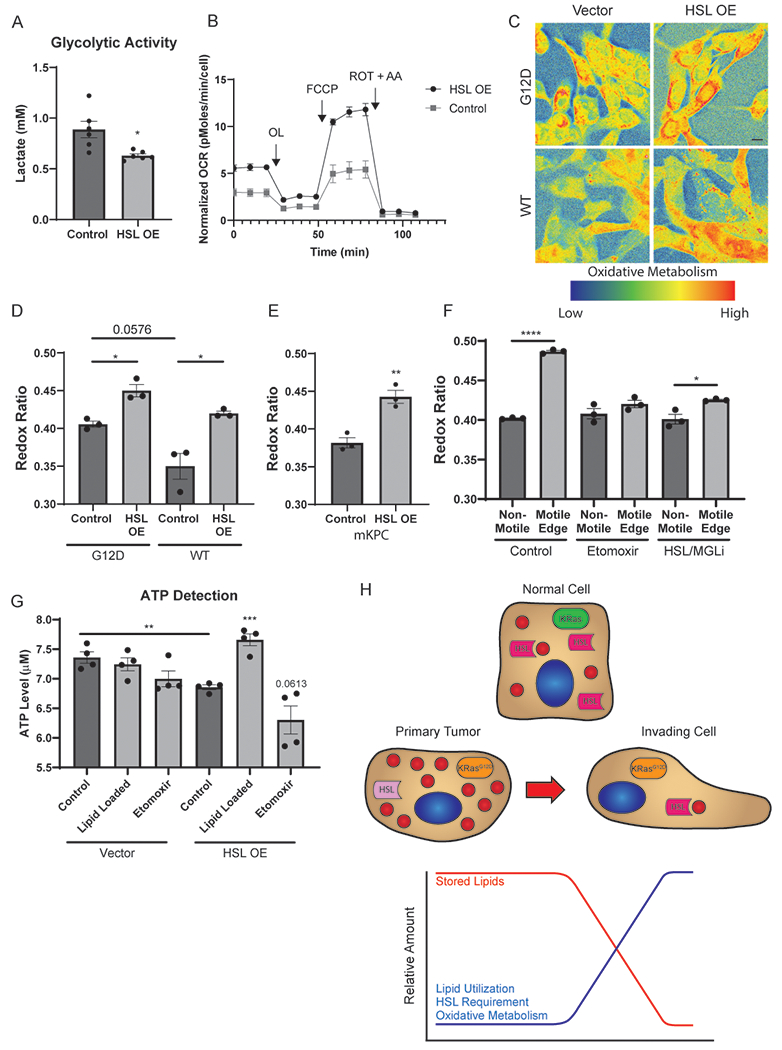
Figure 6.

HSL shifts PDAC cells to oxidative metabolism. A, Analysis of glycolytic activity determined by lactate production of mKPC cells overexpressing HSL or a vector control. Data represent 6 independent biological replicates. B, Quantitation of the normalized oxygen consumption rate (OCR) of mKPC cells overexpressing HSL or a vector control via Seahorse metabolic analysis. Data represent 3 independent biological replicates. C, Representative composite images of the optical redox ratio of iKRAS cells overexpressing HSL or vector control. Cells were cultured in the presence of doxycycline (G12D) or following a 72 hour withdrawal of doxycycline (WT) prior to imaging. Scale bar, 10 μm. D, Optical redox ratio quantitation of the conditions depicted in (B). >40 cells scored in each of five fields for 3 independent biological replicates. E, Optical redox ratio quantitation of mKPC cells overexpressing HSL or vector control. >40 cells scored in each of five fields for 3 independent biological replicates. F, Optical redox ratio quantitation of mKPC cells in a wound healing assay. Cells were treated with DMSO (control), 10 μM Etomoxir, or CAY 10499 (HSL/MGLi) for 4 hours prior to imaging. Cells on the edge of the wound were classified as “Motile Edge” whereas cells at least 4 frames away from the edge were classified as “Non-Motile.” >35 cells scored in each of five fields for 3 independent biological replicates shown. G, mKPC cells treated with 200 μM OA, 10 μM Etomoxir, or grown under control conditions prior to lysis and use in an ATP Detection assay. H, Representation of lipid storage and catabolism during metastatic invasion. Graphs indicate mean ± SEM and analyzed by Student’s t-test. *p < 0.05, **p < 0.01, ***p<0.001, ****p < 0.0001.
