
Figure 1. TSPO expression was elevated in human pancreatic lesions.
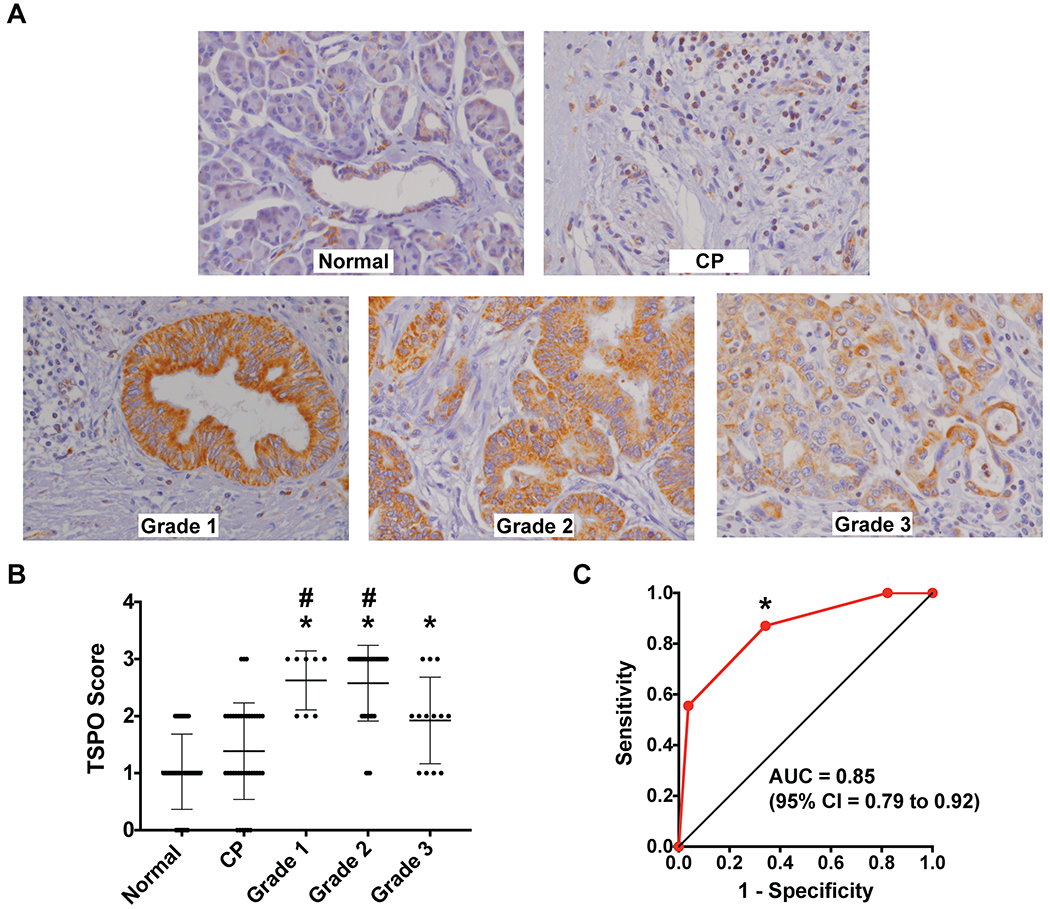
(A) Representative TSPO histological sections (40x magnification) from clinical tissue samples of Normal Pancreas, Chronic Pancreatitis (CP), and Grade 1, Grade 2, and Grade 3 Pancreatic Cancer. (B) Summary of mean ± SD TSPO immunohistochemistry scoring of human pancreatic cancer TMA by three independent reviewers. Asterisks and number signs indicate statistical significance compared to normal pancreas and CP respectively (Wilcoxon rank sums test with Bonferroni correction, p < 0.007 is considered statistically significant). (C) ROC curve plotting Sensitivity against 1-Specificity for TSPO staining in pancreatic cancer (all grades) versus normal pancreas and chronic pancreatitis. The asterisk indicates the chosen point on the ROC curve that results in the values presented.