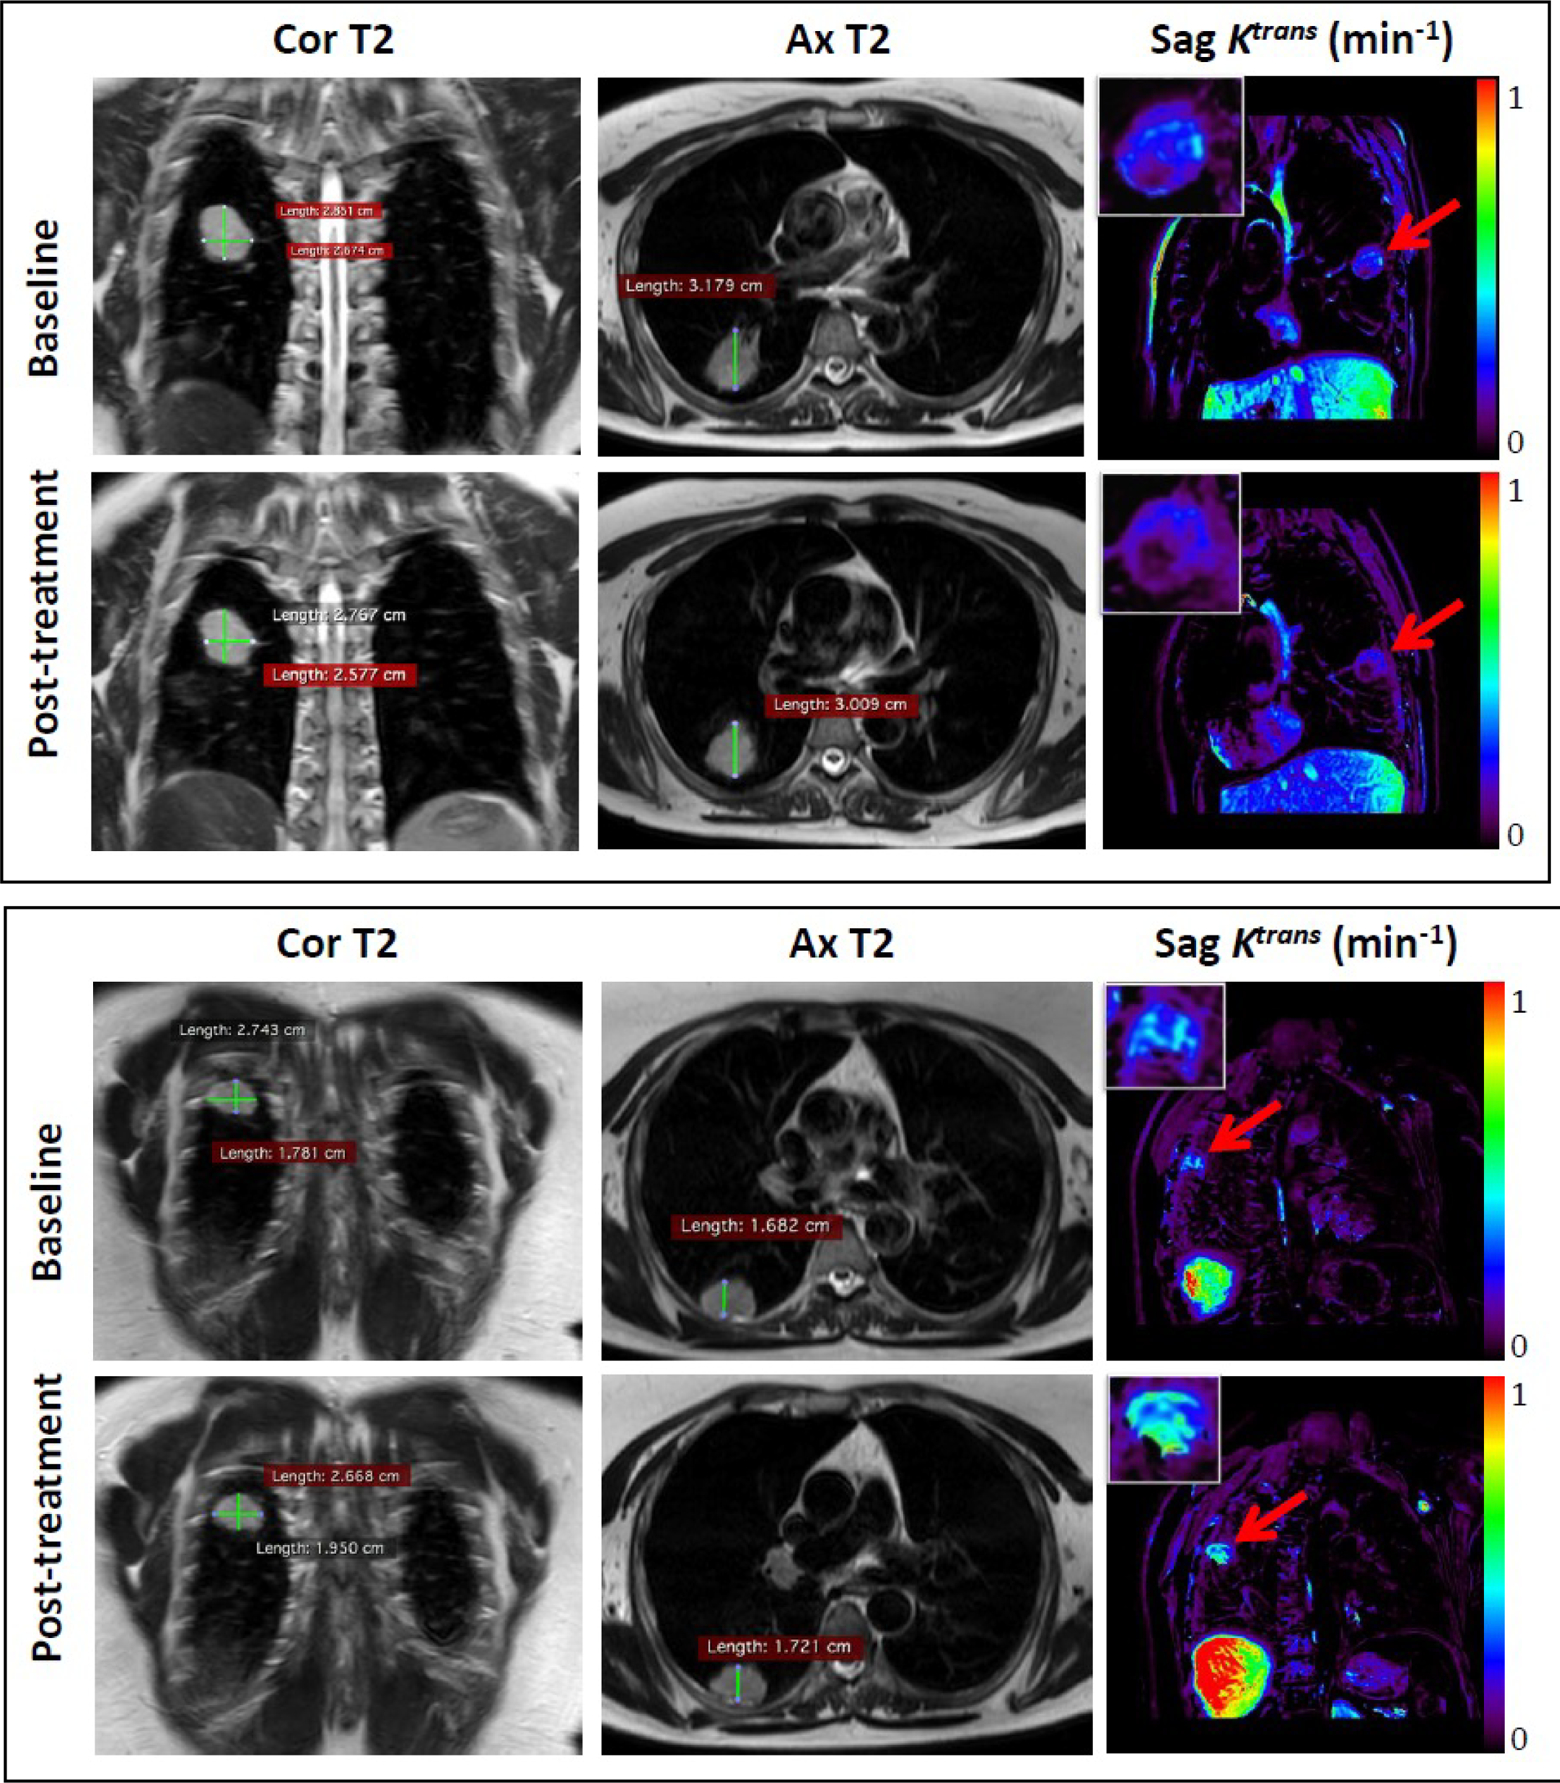
Figure 1. MRI analysis.

Representative coronal (Cor) and axial (Ax) T2-weighted (T2) anatomic images and oblique sagittal (Sag) Ktrans permeability map generated from DCE-MRI at baseline (upper panels) and after treatment (lower panels) in two different patients. Insets show enlargements of the measured tumors. Patient #3 (top): Median tumor Ktrans value at baseline (yellow arrow, upper panel) is 0.17 min−1 and post-treatment (yellow arrow, lower panel) is 0.12 min−1. Patient #12 (bottom): Median tumor Ktrans value at baseline (yellow arrow, upper panel) is 0.32 min−1 and post-treatment (yellow arrow, lower panel) is 0.51 min−1.
