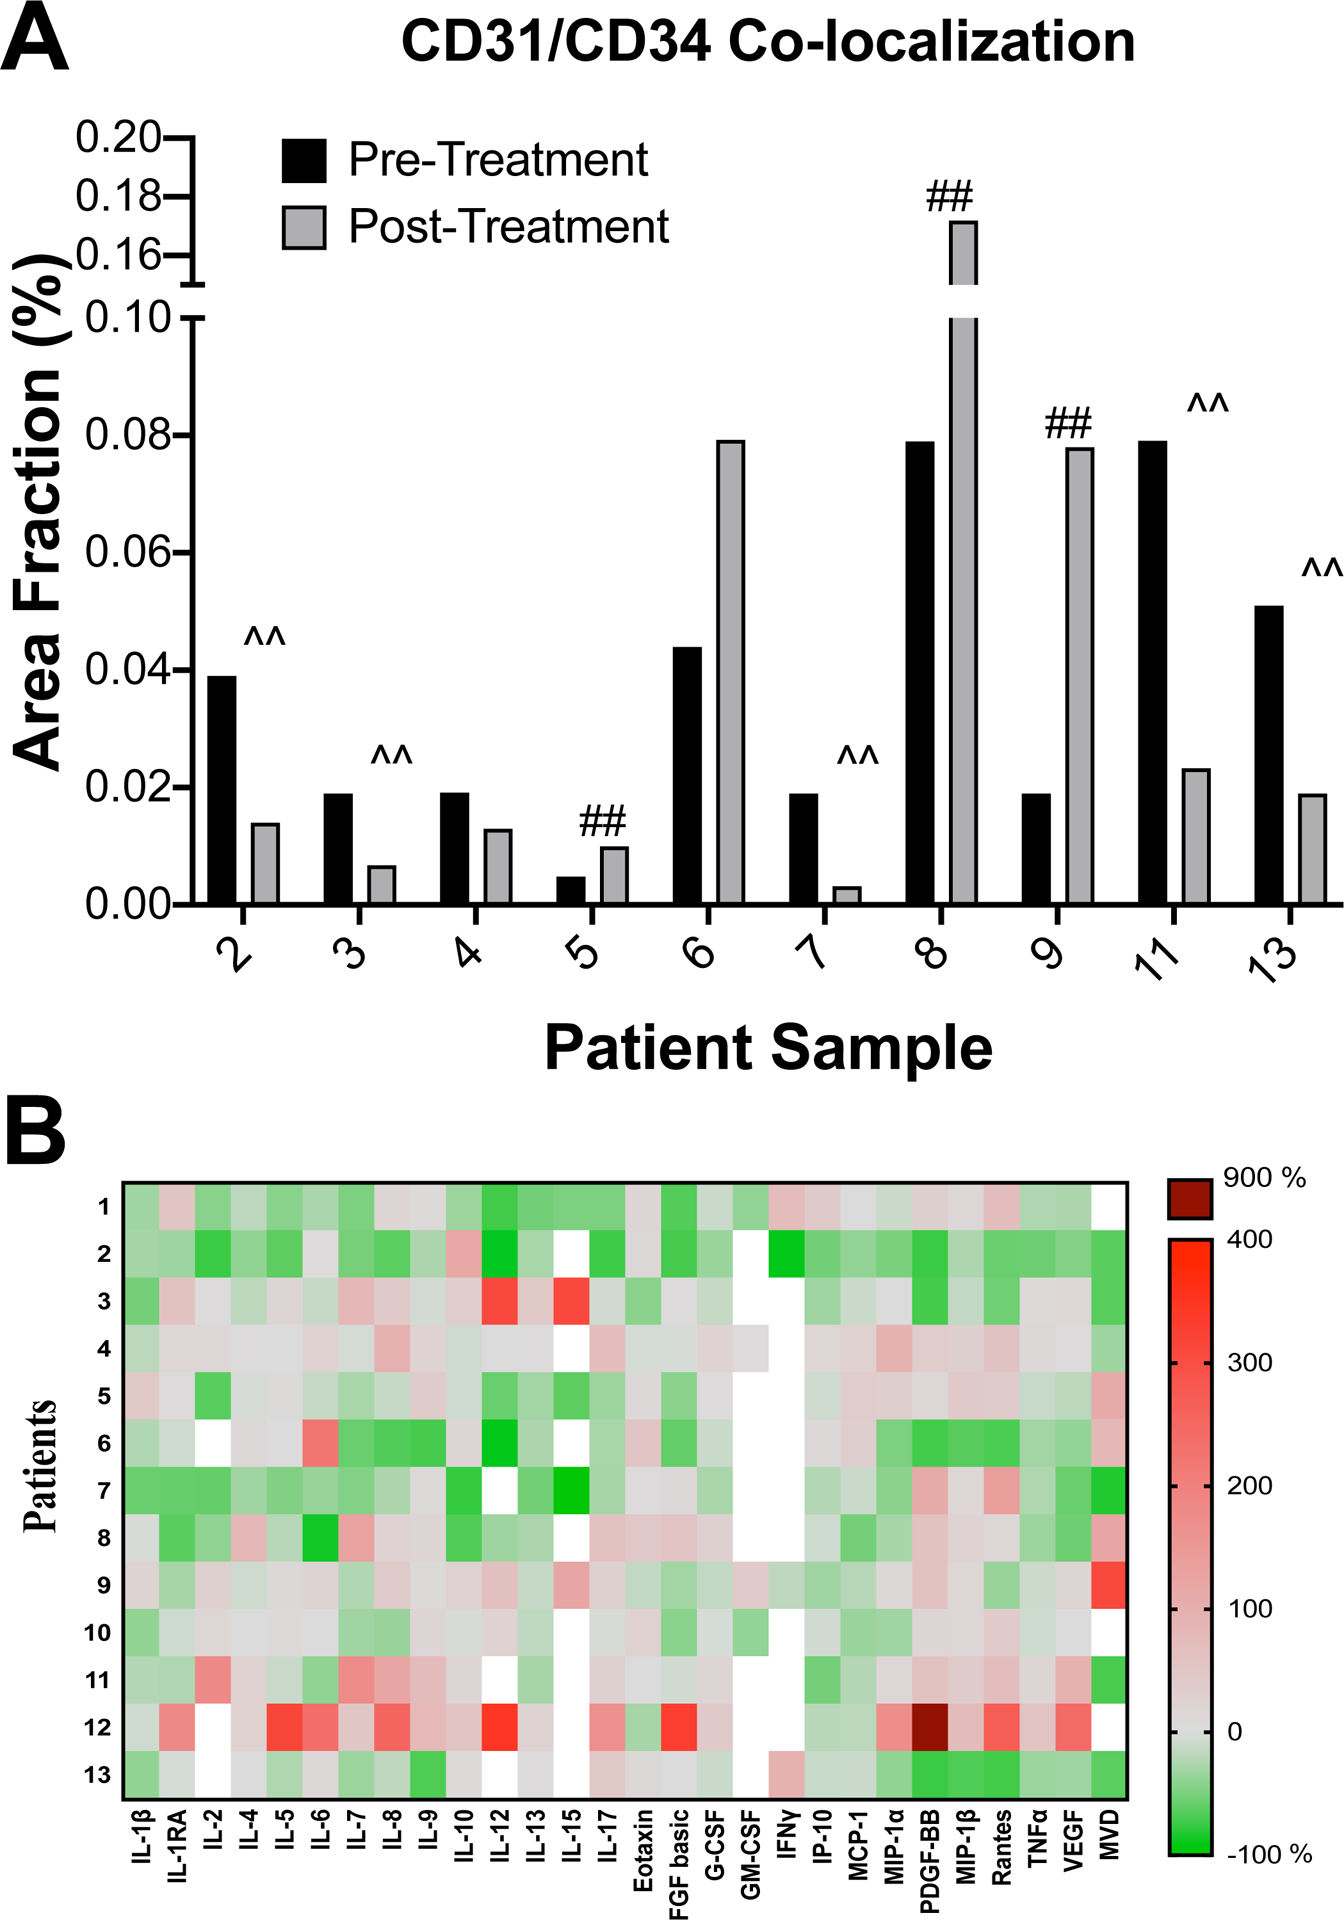
Figure 2. Tumor vascular and plasma cytokine analyses.

(A) Tumor microvessel density. Mean of area fraction of CD31 and CD34 co-localized vessels, as a measure of mean vessel density (MVD), for pre- and post-itraconazole treated tumors are shown. CD31 and CD34 were stained by immunohistochemistry of paraffin embedded sections. ‘##’ and ‘^^’ mark cases that demonstrated an increase and decrease, respectively, of at least 2-fold in the mean of area fraction after itraconazole treatment. (B) Plasma cytokine profiling. Plasma cytokine levels of patients pre- and post-itraconazole were measured with commercially available cytokine panels (see Methods) and compared. Heatmap indicates percent changes in levels of 27 cytokines after itraconazole therapy in 13 patients. Red panels indicate increases in cytokine levels whereas green panels indicate decreases in cytokine levels after itraconazole treatment. White panels indicate cytokine levels that were undetectable in pre- or post-itraconazole plasma samples. Change in MVD is also indicated.
