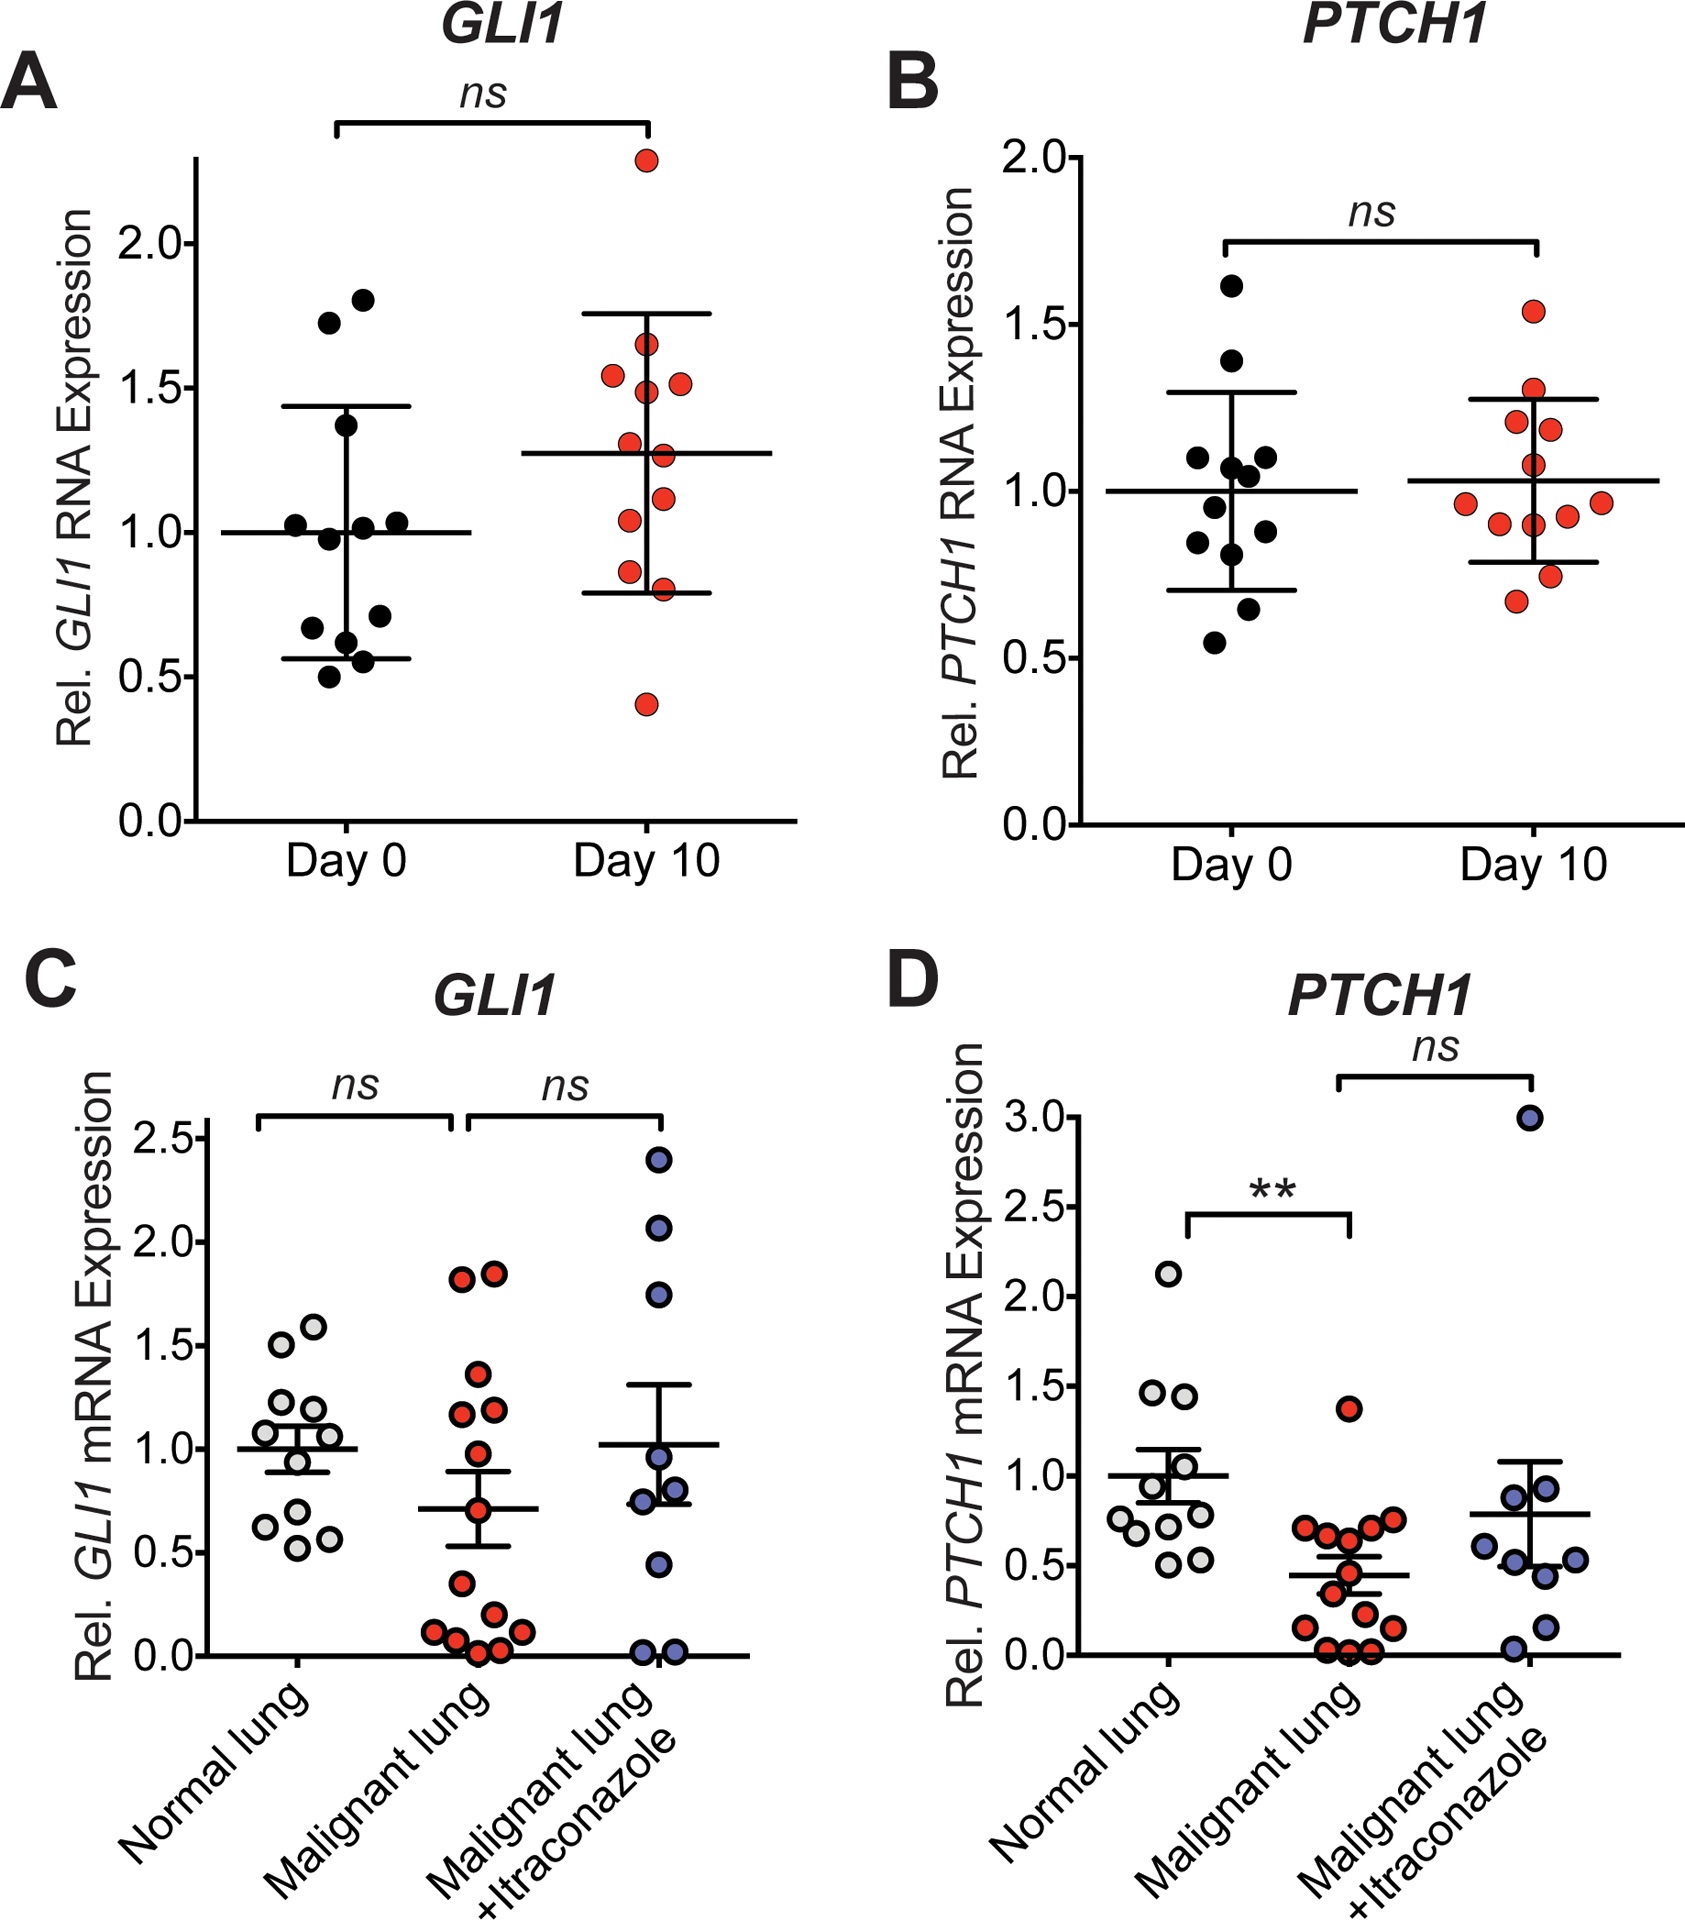
Figure 3. Hedgehog pathway analysis in skin and lung tumor samples.

(A, B) Transcription of GLI1 (A) and PTCH1 (B) mRNA, as a readout for Hh pathway activity, in skin biopsies before and after 10 days of itraconazole treatment is shown. All samples were normalized to the mean of respective day 0 mRNA levels. ns = not significant. (C, D) GLI1 (C) and PTCH1 (D) mRNA levels of resected lung tumors treated with itraconazole, lung tumors and normal lung from other unrelated sample sets are shown. ** P = 0.004; ns = not significant
