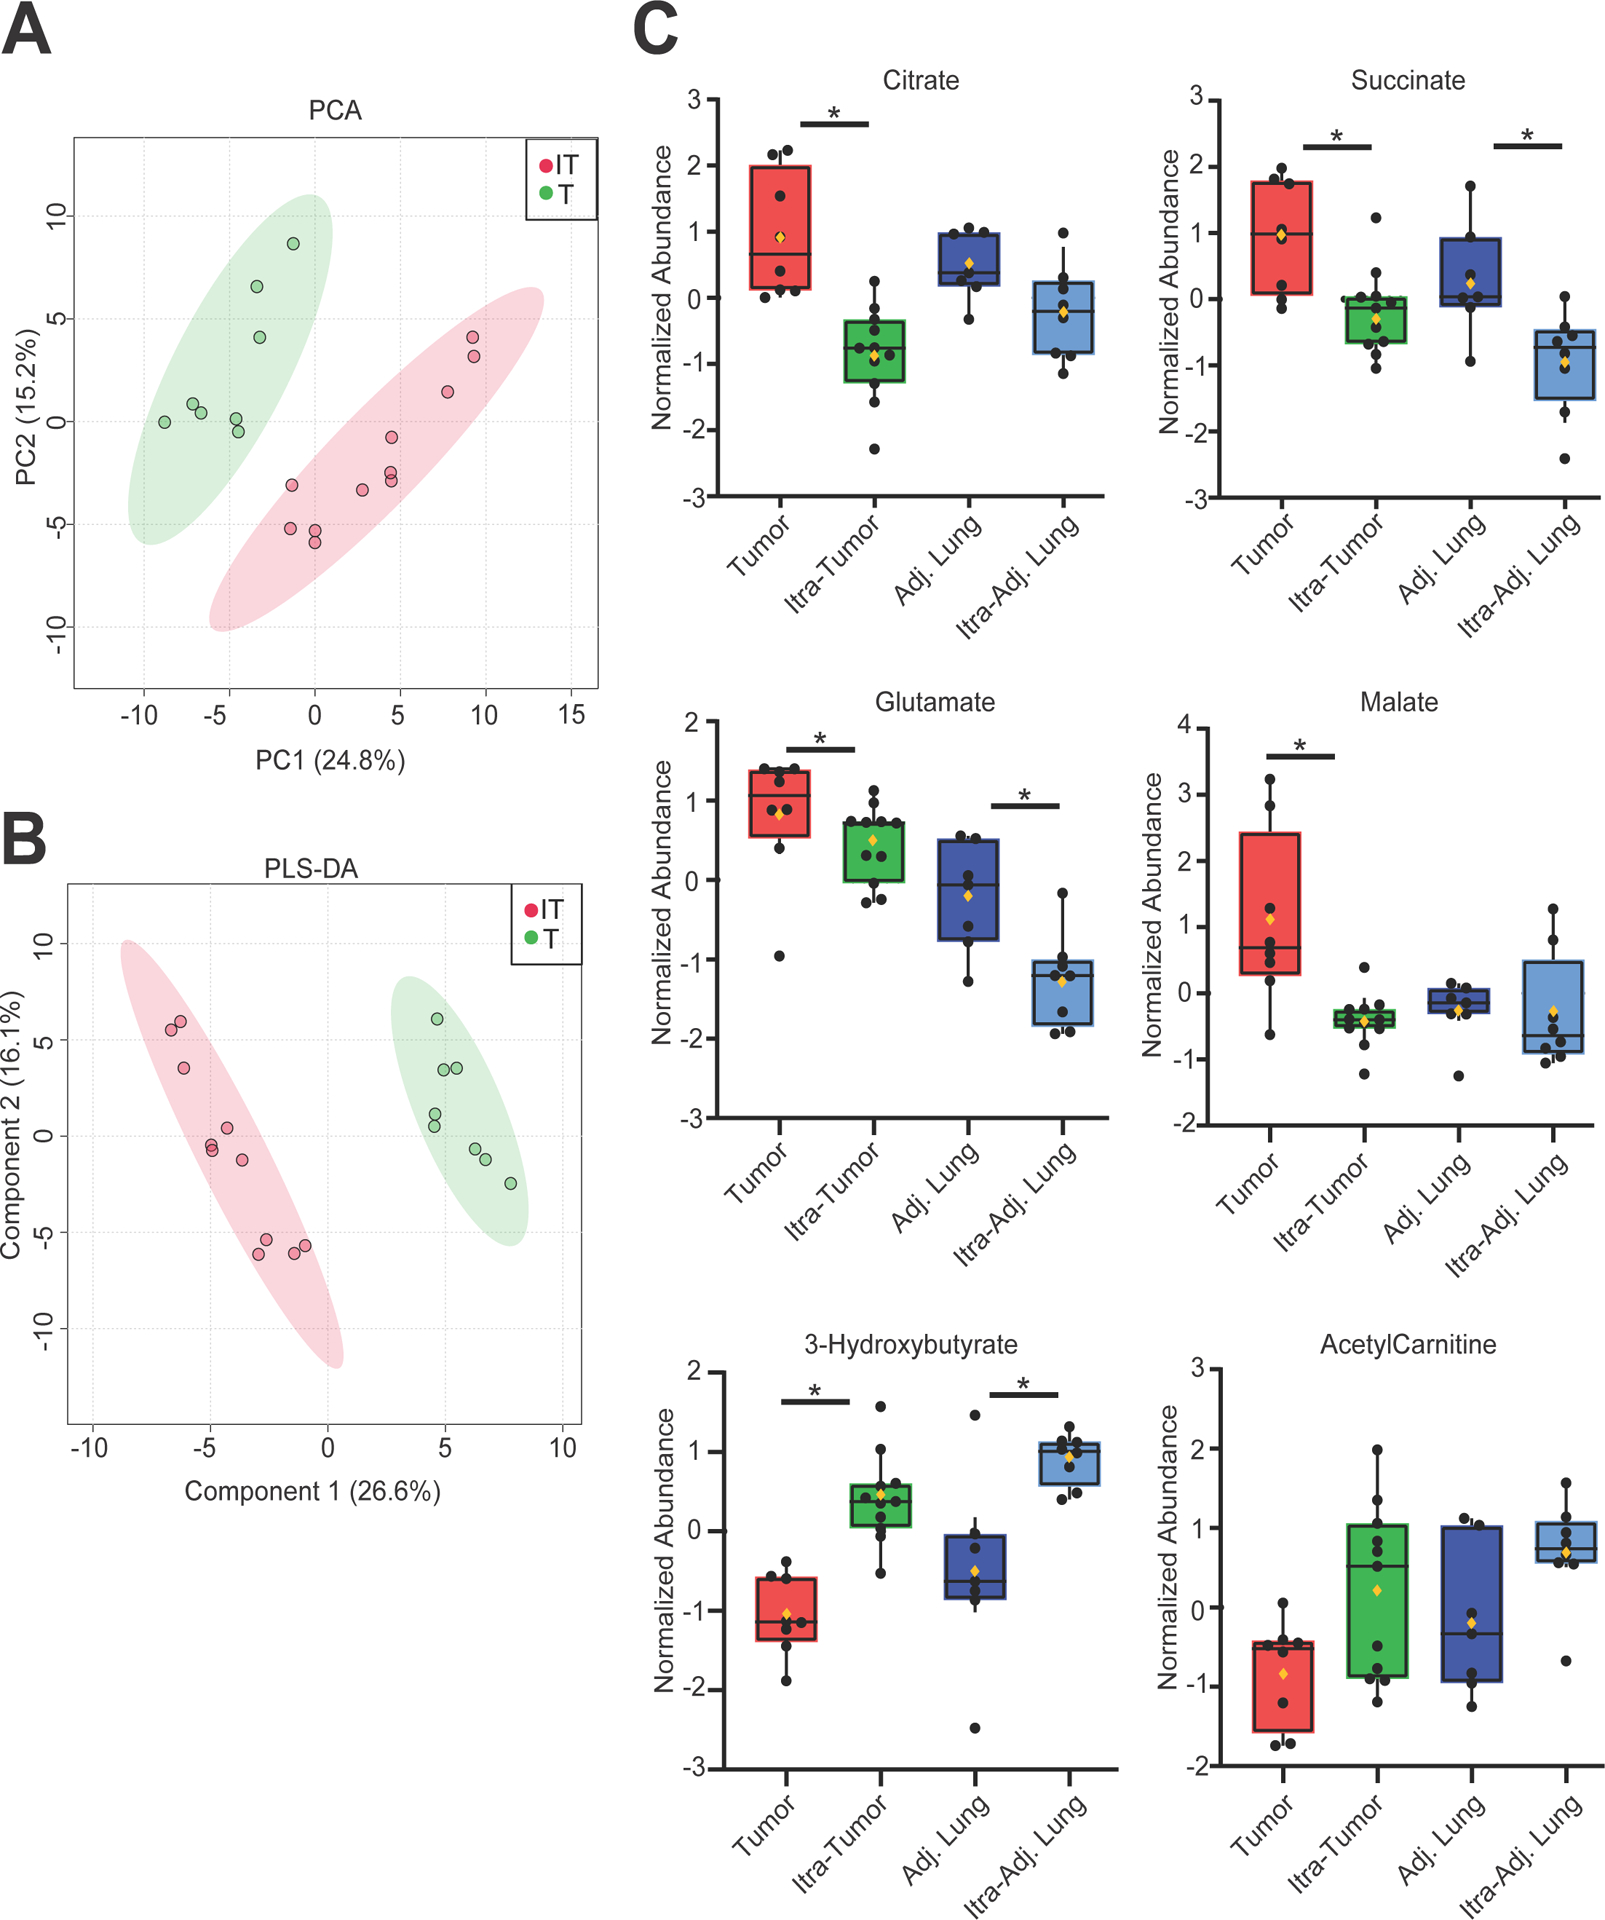
Figure 4. Tumor metabolic analysis.

Treated (red) (n=6 patients, 11 tumor regions analyzed) and non-treated (green) (n=7, 8 regions) NSCLC. (A) Principal Component Analysis (PCA) and (B) Partial Least Squares Discriminant Analysis (PLS-DA) are shown. Colored circles represent the average of three independent fragments from an individual tumor region. IT = itraconazole treated tumors. T = untreated tumors. (C) Changes in individual metabolites. Black dots indicate the relative abundance of the indicated metabolites. The lines indicate the median and 95% CI. The mean value is indicated by the yellow diamond symbol. Non-treated tumor (red), itraconazole -treated tumor (green), untreated adjacent lung (dark blue) itraconazole-treated adjacent lung (light blue). *P < 0.05. Figures were generated using Metaboanalyst 4.0.
