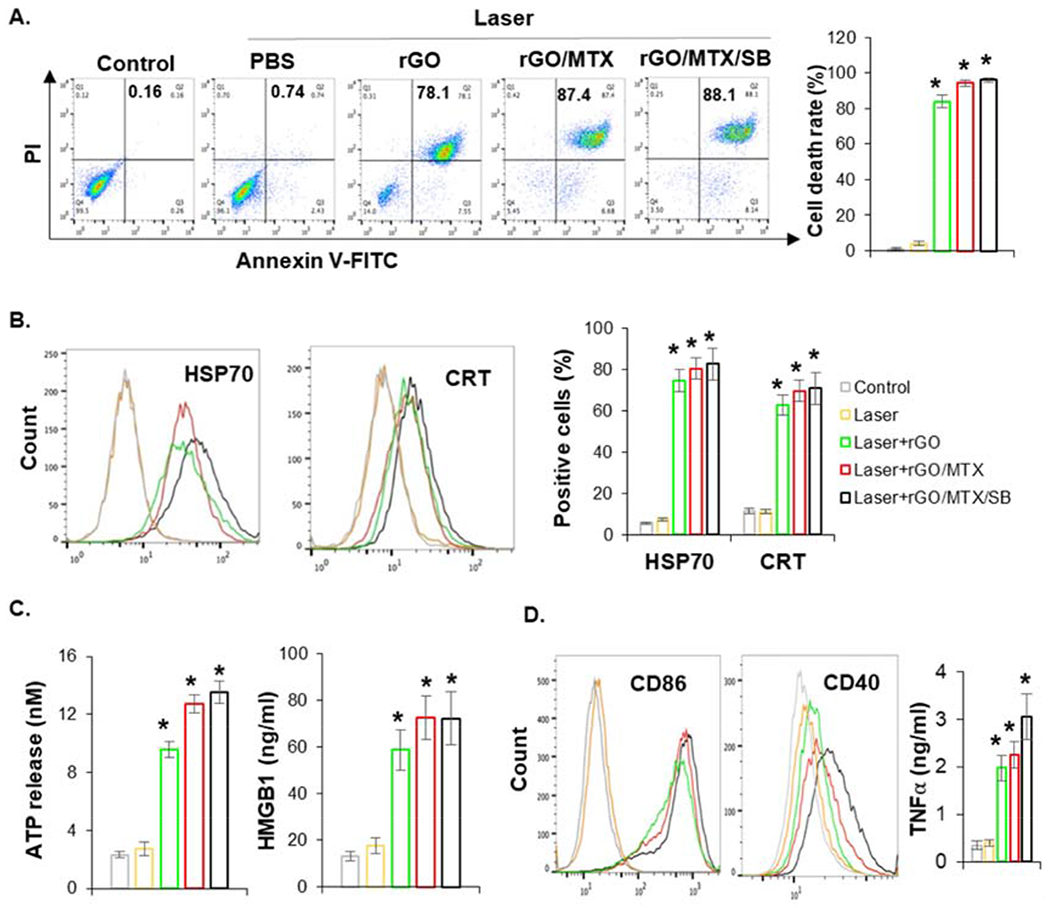
Fig. 4.

Immunogenic tumor cell death induced by rGO/MTX/SB based PTT. A. Cell death analysis by flow cytometry 12 h after the treatments, with Annexin V/PI staining. Bar graph depicts % of cell death, (n = 4, *P < 0.05). B. Surface expression of HSP70 and CRT on tumor cells determined by flow cytometer 3 h after treatments. Bar graph depicts % of cell with HSP70+ and CRT+ staining, (n = 4, *p < 0.05). C. Extracellular ATP and HMGB1 released from tumor cells detected 12 h after the treatments, (n = 4, *P < 0.05). D. The expression of CD86 and CD40 on the surface of BMDCs and secretion of TNFα from BMDCs, stimulated by treated tumor cells. BMDCs were co-cultured with treated tumor cells for 24 h, supernatants were collected and measured by ELISA, cells were collected and stained with PE-CD86/PacBlue-CD40 for analysis with flow cytometer.
