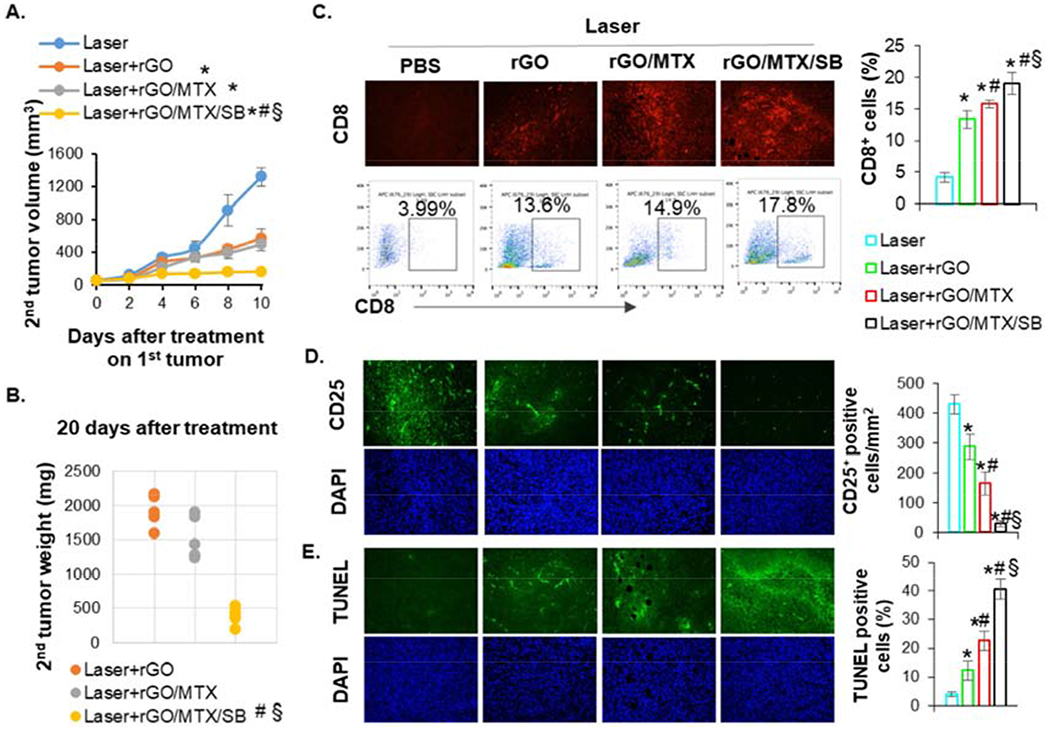
Fig. 7.

Abscopal effect induced by rGO/MTX/SB based PTT. A. Volume of secondary untreated tumors after indicated treatments on the primary tumors in mice that inoculated with two tumors, (n = 5, *p < 0.001 vs Laser; #p <0.001 vs Laser + rGO; §p < 0.001 vs Laser + rGO/MLX). B. Weight of secondary untreated tumors harvested 20 days after treatments of primary tumors, (n = 5, #p < 0.001 vs Laser + rGO; §p < 0.001 vs Laser + rGO/MLX). C. Representative IHC staining and flow cytometry plots showing CD8+ T cells in secondary tumors. Bar graph depicts the proportions of tumor-infiltrating CD8+ T cells (gated by CD3+) in secondary tumor, (n = 4, *p < 0.001 vs Laser; #p < 0.05 vs Laser+rGO; §p < 0.05 vs Laser + rGO/MLX). D. Representative IHC staining showing CD25+ cells in secondary tumors. Bar graph depicts the numbers of tumor-infiltrating CD25+ cells in secondary tumor. (n = 4, *p < 0.01 vs Laser; #p < 0.01 vs Laser+rGO; §p<0.001 vs Laser + rGO/MLX). E. Representative LUNEL staining showing cytotoxic effects in secondary tumors, (n = 4, *p < 0.005 vs Laser; #p < 0.005 vs Laser + rGO; §p <0.001 vs Laser + rGO/MLX).
