
Figure 4. HIF-binding sites are methylated in some breast cancer cell-lines.
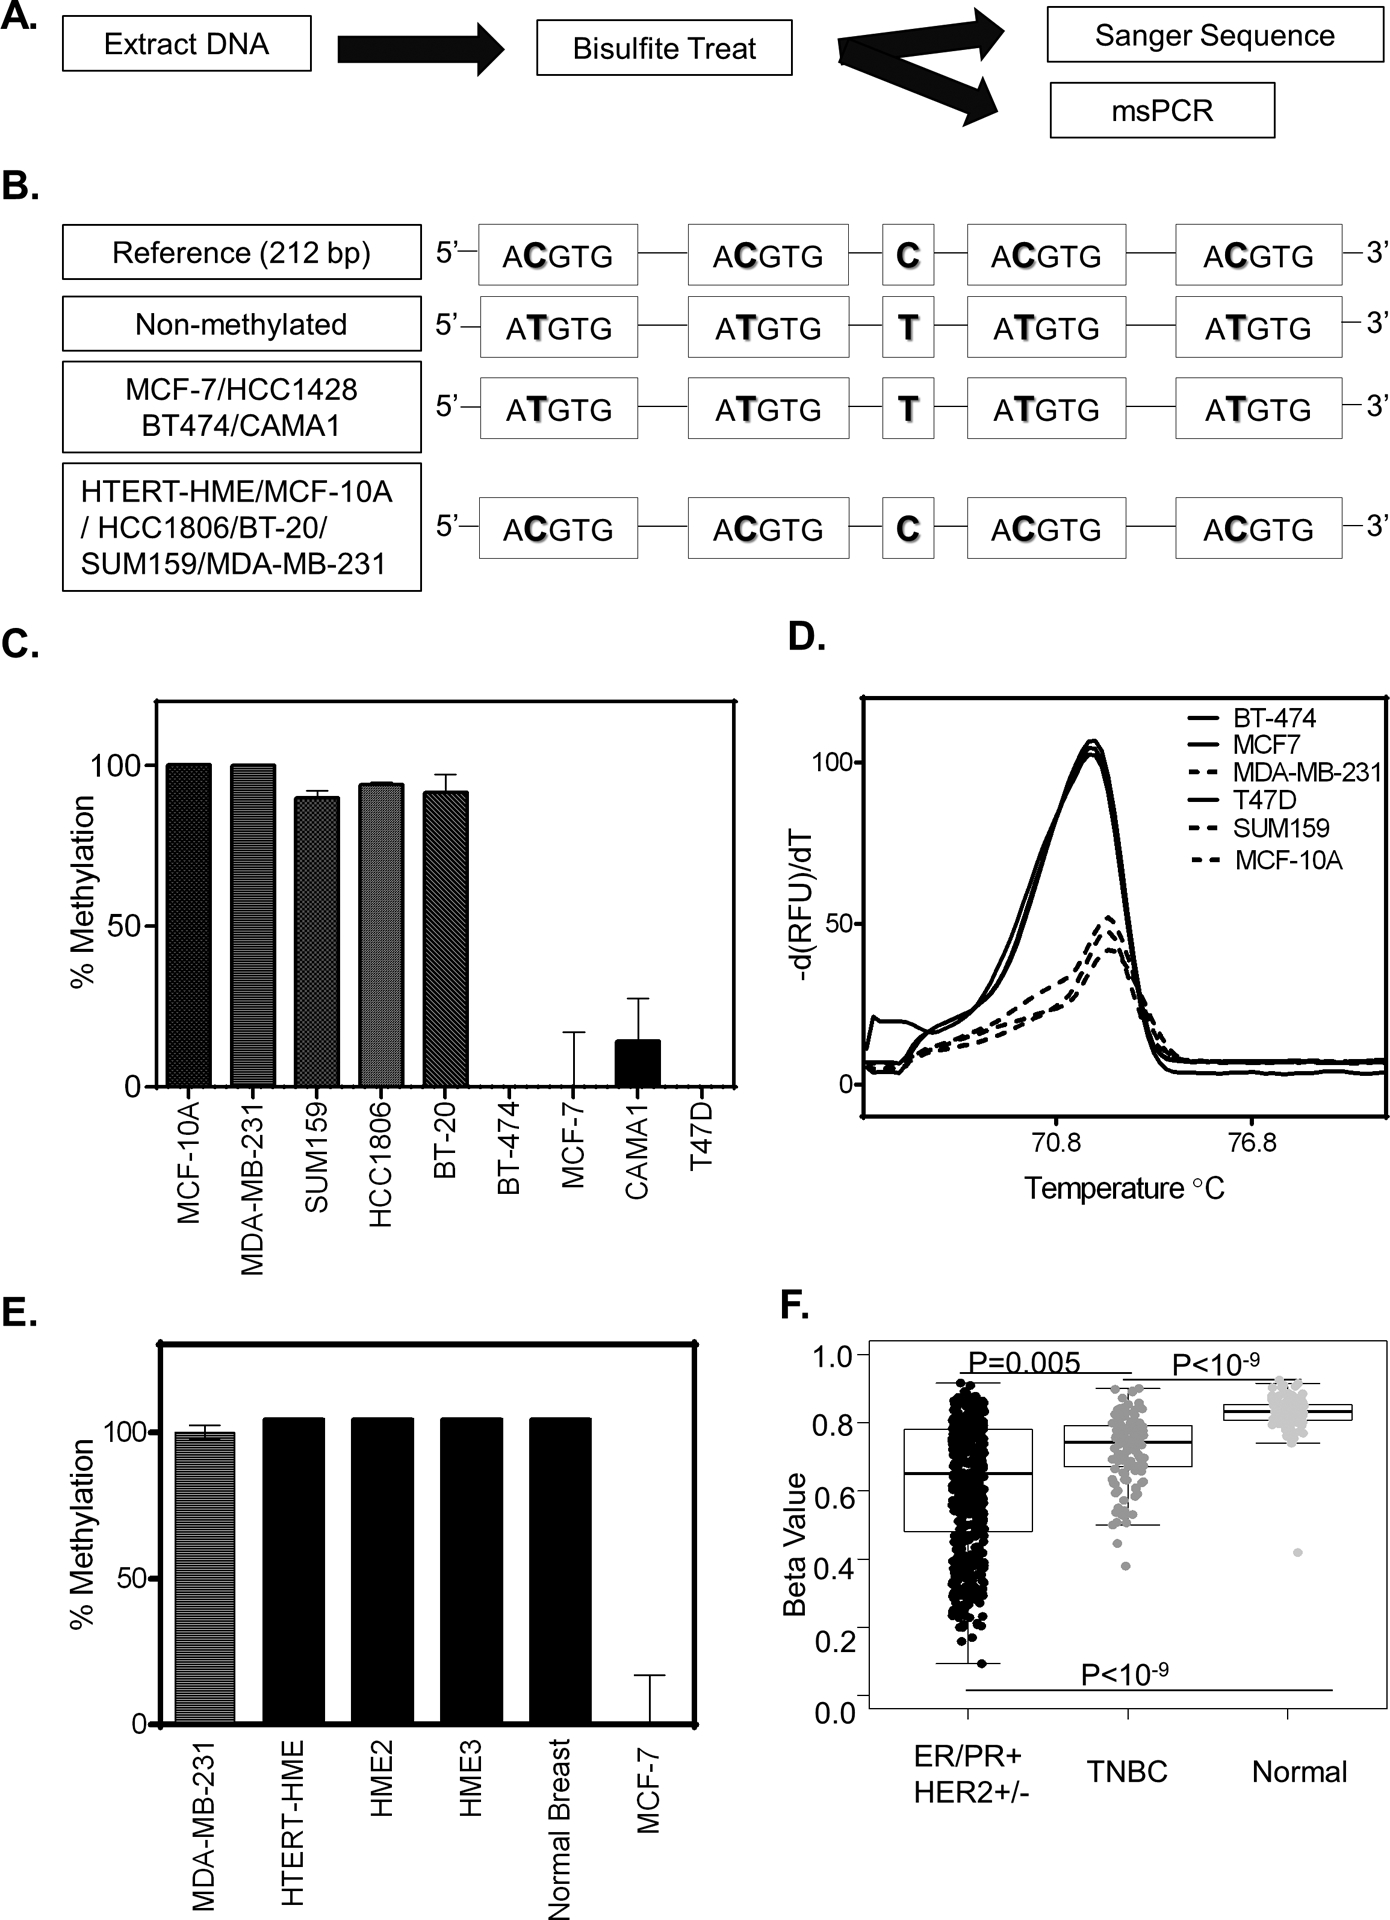
A. Schematic overview of experimental design to assess methylation status. B. Sanger sequence of PCR amplified bisulfite treated DNA for the cell lines indicated. C-E. Methylation status as measured by methylation-specific qPCR using a primer specific for the non-methylated HIF-binding region of EGFR for cell lines indicated. (C) The methylation percentage was calculated by first standardizing all expression values to MCF-7 and then normalizing the result to MDA-MB-231(MDA-231). (D) UAnalyze software was used to plot the melt curves from the methylation specific-high resolution melting (MS-HRM) analysis of the indicated cell lines. (E) Percent methylation as determined in normal breast tissue. F. Boxplots showing the methylation level in breast cancer patients based on cancer subtypes compared to normal breast tissue. (P-value is calculated by the wilcox.test, ER/PR+ HER2+/− n= 551, TNBC n=122 Normal n=97).